NSF Workshop on Canopy Structure Data - Dr. Robert Van Pelt
Development of Canopy Structure in Douglas-fir Forests of the Pacific Northwest
Robert Van Pelt, Nalini Nadkarni The Evergreen State College, Olympia, WA
This study focused on structure/function relationships in a sequence of structurally simple to diverse forest plots in the Western Cascades. The field work was implemented by Dr.Van Pelt and our students. We established a set of eight plots in which we made measurements of stand-level and within-tree structure and three elements of canopy function: rainfall interception, air temperature/relative humidity, and light interception. The data and metadata were then organized and put into a field database that was designed by our database programmers.
Stand-Scale Structural Measurements
Transects were selected as the sample unit, as they provide a convenient way to sample a stand, while retaining the ability to example many spatial aspects of the stand (Kuiper 1994, Van Pelt 1995). The axis of each transect can serve as the sample locations for understory vegetation, light distribution measurements, precipitation throughfall measurements, etc.
Transect locations
Sample areas at each location are located in large, low gradient blocks
of forest with care to ensure plot boundaries are well away from clearcut
edges, etc. A reconnaissance survey was conducted prior to sampling to
determine exact stand locations. Each study site was analyzed using aerial
photographs and/or Forest Service inventory GIS layers, then stand polygons
were generated using a GIS. Stand boundaries were chosen and transects
were randomly assigned inside of the stand polygons. In each sample area,
4 transects were placed with random starting points and directions. The
first four random transects that remained inside the boundary of the stand
polygon were chosen as the study transects. The average height of the
canopy dominants was determined from prior sampling within the permanent
plots or reconnaissance, which were then used to determine transect size.
Transect dimensions are 3 x 0.3 the average dominant tree height. For
example, a 50 m tall stand will be sampled by four transects, each of
which are 150 m X 15 m.
Transect sampling
Within each transect, all trees greater than 5cm dbh were mapped and measured
for species, dbh, height, crown height, and 4 cardinal crown radii. Mapping
was accomplished by setting up a transect line using 100m tapes and rebar.
A compass was used to establish the randomly chosen direction. The 'X'
corrdinate of each tree is simply the distance along the tape at which
the tree occurs. The Impuse laser rangefinder was used to get the 'Y'
coordinate, or, the distance from the tape. A +/- sign was determined
by which side of the tape the tree being measured occurs. Anomalies of
tree form are noted, such as broken tops, spike tops, wounds or other
abnormalities.
Along the axis of the transects, in a band 10% as wide as the main transect, trees not yet mapped yet greater than 50cm in height, were mapped and measured for species, basal diameter, height, crown height, and crown diameter. All other woody plants (shrubs) taller than 50cm in height were also sampled in this smaller transect. These were measured for species, height and basal diameter. The exception to this general sampling scheme is in reference to vine maple (Acer circinatum). Vine maples were not condidered trees even though they can frequently be over 5cm dbh. For these individuals over 5cm dbh, their dbh was recorded rather than a basal diameter, but only for 'trees' within the smaller, 10% transect. Understory vegetation was sampled as percent cover by cover type in a continuous string of 1m diameter circles for the length of each transect. Three cover types were used; evergreen shrub, deciduous shrub, and herb/moss.
In each stand a 10% sample size for each species was chosen for stem volume measurements. These were used to develop regression equations predicting volume from height and dbh. The Criterion 400 survey laser was used for this purpose. The full range of sizes for each species was included in a randomly selected sample. In addition, the largest and smallest individuals in each stand for each species were also measured to insure that the predictive equation does not predict tree volumes beyond its own data. Trees with abnormalities such as kinks, swellings, or deformed crowns were not sampled for these regressions.
WITHIN TREE STRUCTURAL MEASUREMENTS
Each site had one transect randomly chosen for more detailed examination.
Within this transect, hereafter referred to as the 'Focus Transect', more
detailed information about tree architecture was collected. Trees were
climbed and the architecture mapped in accordance with criterion previously
established by Sillett and Van Pelt (Sillett 1999, Van Pelt and North,
1999, Sillett and Van Pelt, 2000). This involves mapping the location
of the main stem and all reiterated trunks, in addition to all branches
that originate from trunks. Each mapped trunk and branch was measured
for basal diameter, length, azimuth, and foliage unit number. A foliage
unit is a discrete aggregation of twigs that develop over time on tree
branches. This is proposed as an improvement over previous methods that
have also estimated foliage amounts in old-growth Douglas-fir (Pike, et
al. 1977, Massman 1982, Clement and Shaw 1999, Ishii, et al. 2000) and
Sitka Spruce (Ellison, in review). To determine the correlation between
foliar unit size and foliage biomass, a small subset of individual branches
was clipped for leaf area and biomass estimations for each species and
stand, which were used to extrapolate to the stand level.
The climbing of these trees in these eight stands requires complete rigging all of the major and many lesser trees within the focus transect. Each branch on each rigged tree was mapped and measured for up to 12 variables. The foliage on these branches was then estimated from regression in the case of most trees, or be estimated from foliar unit sampling in the case of the old-growth Douglas-fir trees.
RIGGING TALL TREES
Rigging a tall tree for intensive study occurs in 5 phases: 1) setting
the initial rope, 2) accessing the lower crown, 3) accessing the upper
crown, 4) establishing the climbing route, and 5) descending. Each phase
is described below.
Setting the Initial Rope-There are many ways to set the initial rope for tree climbing. Choosing the right method depends on the type of tree to be climbed. If the tree is small-sized, the climbing rope is thrown directly over sturdy branches up to 10 m high. For medium-sized trees, a throw bag is used (canvas sack with lead shot inside) tied to a nylon cord to access branches up to 25 m high. Very tall trees in old-growth forests are usually not accessible by these techniques, because the lowest sturdy branches in their crowns are frequently located above 30 m. A powerful, compound bow is used to shoot a rubber tipped arrow over sturdy branches in the lower crown. The vertical range in our work is up to 85 m. The arrows are tied to medium-strength monofilament, which is attached to a spinning reel on the front of the bow. If the shot misses, and the arrow goes over an unsafe branch, the arrow is lowered to the ground, untied, and the monofilament is reeled in. After a successful shot over a safe branch, a nylon cord is tied to the monofilament and pulled up over the branch. The cord is strong enough to then haul the climbing rope over the branch. When both ends of the climbing rope are on the ground, one end of the rope is anchored to a tree trunk with a knot. Now the rope is ready to be climbed.
Accessing the Lower Crown-The rope is climbed using two ascenders attached to the climbing harness. Foot stirrups are attached to the lower ascender. By alternating between standing and sitting, trees can be climbed fairly rapidly. Once the branch supporting the climbing rope is reached, an arborist-style lanyard is used to anchor to the tree. The climber then detaches from the climbing rope and signals an assistant to untie the knot at ground level. The climbing rope is then pulled up attached to the climbing harness.
Accessing the Upper Crown-Our climbing lanyards consist of a 20 m long arborist-style rope with locking steel clips spliced into both ends. Two 1 m lengths of arborist-style rope are tied to the middle of the lanyard with Blake's hitches such that about 0.6 m of each rope is left as a tail. The Blake's hitch is a special friction knot that allows a climber to safely ascend and descend a rope by sliding the knot along the rope. Each tail has a double-locking carabiner spliced into the end. To anchor oneself to the tree, one end of the lanyard is thrown over the base of a sturdy branch, the steel clip is lowered by tossing loops of slack up towards the branch, and the clip is attached to the climbing harness when it comes within reach. All of the slack in the rope is removed by sliding the Blake's hitch and by attaching the tail to the climbing harness. Using the branch as if it were a pulley, the climbers hoists himself up the lanyard while sliding the tail along for safety. When the branch is reached, the other end of the lanyard is used and the procedure is repeated by throwing it over the base of a sturdy branch located up to 7 m higher than first. The second tail is used to ascend the other end of the lanyard. In this way, the climber is never detached from the tree - the first tail is detached when all of the climbers weight is on the second tail. This method is repeated, which is known as split-tail climbing, until the upper crown is reached. As branches become smaller towards the top of the tree, the trunk is used as the pulley.
Establishing the Climbing Route-A rescue pulley is secured to the trunk in the upper crown with a loop of 2.5 cm tubular nylon webbing and a locking carabiner. The pulley is hung above a sturdy branch. One end of the climbing rope is passed through the pulley and lowered to the ground along a clear path that will be independent of the climbing path. Using two-way radios, an assistant on the ground signals the climber that both ends of the rope are back on the ground. The assistant then anchors the end that was just lowered. By being careful during the previous phase, a clear climbing path is established during the initial ascent. If not, the climbing path is rerouted upon descent.
Descending-Standard techniques are used to rappel to the ground. Rappelling involves using a friction device that attaches to the rope and allows a controlled descent. Once back on the ground, a black nylon cord is tied to one end of the rope with a special knot. The rope is the replaced by the cord, which is left hanging from the pulley at the top of the tree with both ends tied and secured at ground level. The black cord is virtually invisible. On a good day, the whole rigging procedure takes about three hours for a 90 m tall tree. On a bad day, it takes the whole day.
Outer crown access-Safety restrictions limit access to the outer and uppermost portions of the tree crown. To minimize these restrictions, a new access technique was developed and has been successfully employed. Two 120m ropes are fixed near the top of the tree at rope midpoint resulting in four 60m long ends. Each end is threaded through Y-shaped branch crotches some distance from the central trunk until the rope is supported near the crown edge. Additionally, each line is equally spaced by azimuth so that there is a rope on the outer crown at each of the cardinal directons (N, S, E, & W). These outer crown ropes provide the much-needed pendulum to safely access the outer crown. These ropes may be as far as 8 meters from the trunk and researcher thus have to be snagged using miniature grapnels attached to fly-fishing line. To cut down on time and frustration, the fly line is loaded in an automatic fly-fishing reel mounted to the researches harness. Once the rope is snagged, the flip of a button siphons the fly line back into the reel. The researcher can then triangulate into the outer crown using the outer crown rope and a lanyard placement near the trunk. Despite these advancements in access, there are still areas in the upper and outer-most portion of the crowns that are inaccessible.
TREE MAPPING
Each tree is mapped in detail to establish the location and estimate the
surface areas of branches and foliage. Height tags are placed on the trunk
every five meters and identification tags are placed at the base of each
branch. The following information is recorded for each uniquely labeled
branch: height of branch above ground, perpendicular distance of branch
extension from trunk, diameter of branch at insertion, azimuth of branch
at trunk, and total length of axis system (live and dead branch portions
>4cm in diameter). The foliage on each branch is also assessed. For
young trees (trees that still conform to their original architectural
model), the slope and percent of branch foliated are measured. For more
complex (branched) branches in these trees the distance and azimuth of
branch system centroid is recorded, along with the width and depth of
ther foliated portion of the branch. A centroid is the center of mass
of the foliated part of the branch, ignoring all woody parts of that branch.
For old-growth trees (trees whose branches no longer conform to the original
architectural model of the species) these factors are also measured. Instead
of the percent of the branch foliated, however, the number of foliar units
on that branch are counted. Foliar units are discrete quantities of foliage
that can be counted by the researcher to reasonably estimate the quantity
of foliage on a particular branch system. Due to the unique clustering
pattern of foliage, these units are specific to the tree species and reflect
a relative quantity of foliage. So far, in the tree species we have worked
in, these are easily recognizable units. Each researcher agrees as to
the defined foliar units and by constantly checking count estimations
with each other and by frequently changing climbing partners, some level
of consistency is maintained.
Destructive Sampling - A subset of branches for each species and size class will be collected for leaf area and biomass calculations. These will be measured, dried, and the various components weighed to provide data used to develop regressions for predicting the size of the estimated branches within the trees. For the Douglas-fir trees in the older sites, branches will not be removed. In the stands where foliar units were counted, a subsample of these were removed for analysis. Foliar units were collected at the beginning and end of each day by each climbing crew. These were each individually estimated by all climbers to aid in our daily self-calibration. Members of each climbing crew were rotated to provide a further self-check for calibrating foliar units size.
Functional Measurements
The axis of each transect was used as the primary location of light sampling and precipitation throughfall measurements. Each transect, with a few exceptions, has 10, randomly selected sampling stations for both light and precipitation throughfall. The exceptions are those few transects that ended up being too close to roads or trails. In these cases, twenty stations were set up in one of the other transects. Each stand ends up with 40 sampling stations.
Precipitation and understory throughfall
Precipitation throughfall was sampled in each stand to estimate variations
in precipitation intensity and crown drip based on canopy structure. A
tipping-bucket raingauge was installed in a large opening near the stand
to get background precipitation data. These record a time-stamp with every
2mm event and only need to be downloaded twice a year. At two of the sites
an official government weather station was very close to the stand and
these data were used instead of collecting our own. The throughfall sampling
has a two-tiered approach; one method samples throughfall at a high spatial
resolution, but fairly low temporal resolution, the other samples at a
high temporal resolution but integrates over a large area of the understory.
Throughfall was sampled on the forest floor and collected through a series of hand-sampled bottles randomly placed along the transects. The 40 sampling locations in each stand are the same as that for the hemispherical photos. These were remeasured as often as possible after major rainfall events so were left in the field for the duration of the study. Each sampler cosists of a two-liter bottle mounted on a wire frame that elevates it 1-2 m above the forest floor. The mouth of the bottle is fitted with a short piece of rubber hose and a funnel. The small opening helps reduce evaporation during the times water is sitting in the bottle. Sampling is done by periodically emptying the bottle into a graduated cylinder and recording the total amount of water. The measurement of total precipitation reaching the forest floor was augmented by a tipping-bucket raingauge fitted with long trough that allows higher resolution to the time of throughfall sampling, but integrates over a large spatial area. One of these was placed on each transect.
Air temperature/Relative humidity
Air temperature and relative humidity were sampled at the top of the canopy
in each stand and in the understory. Due to the variability of the understory
conditions, both air temperature and relative humidity were sampled at
three places in the understory for averaging and variance. The small,
inexpensive, yet weather-proof temperature/humidity sensors made by Hobo
Inc., are self-contained and thus ideal for sampling at widely-spaced
intervals.
Light distribution
Digital hemispherical photos were taken at each sampling station location
and were analyzed to estimate light levels in the understory. Sampling
at 40-50 locations within each stand will yield an estimate of total light
available in the understory as well as the patchiness and variability
of that light.
Visualizing Canopy Structural Data
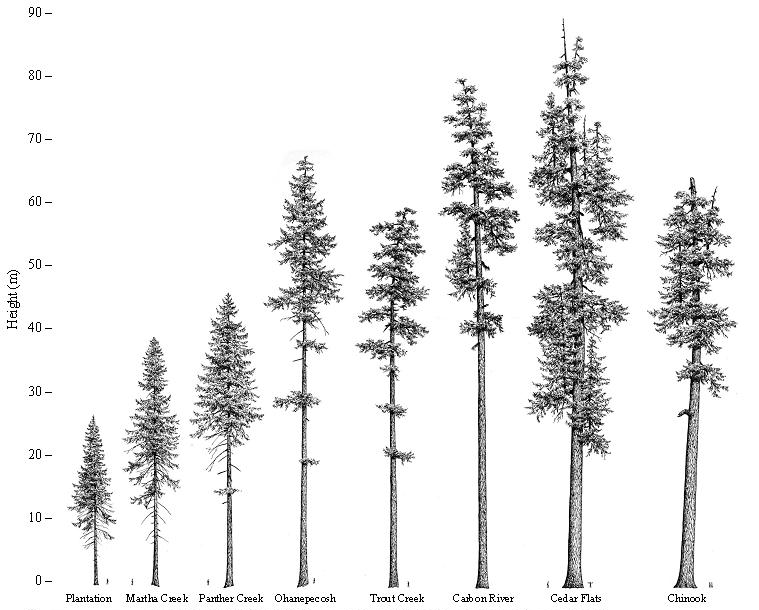
Detailed drawings to scale of a dominant tree from each of the eight sites. This will at least give a visual comparison of the size and structural changes. Drawings by Robert Van Pelt.
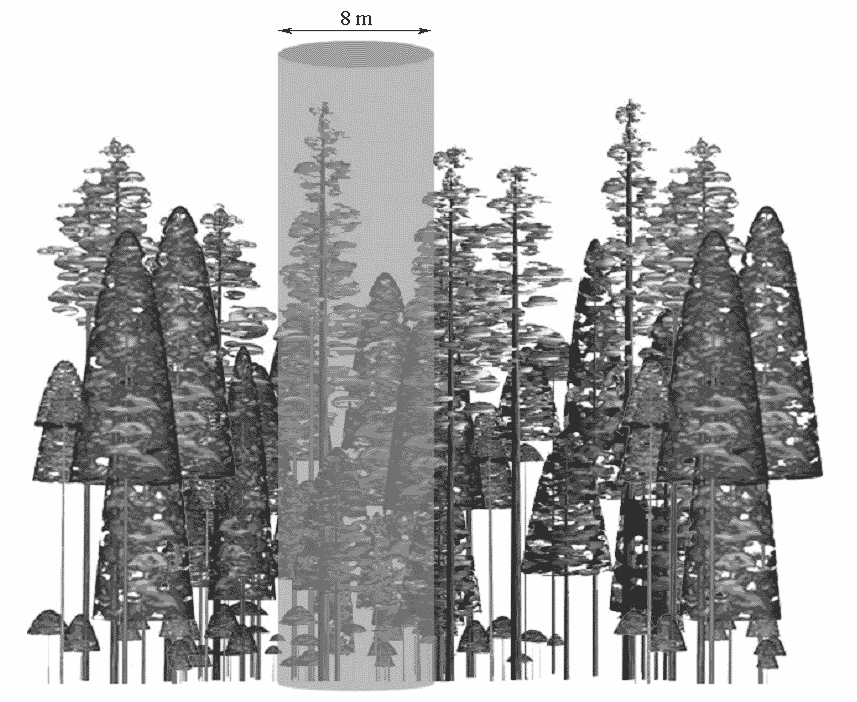
Illustration of the 8 m diameter cylinder used to sample crown volume for use in the semivariance analysis.