NSF Workshop on Canopy Structure Data - Betsy Lyons
Betsy Lyons
Crown Structure and Spatial Distribution of Epiphytes on Western Hemlocks in an Old Growth Coniferous Forest
BRANCH SAMPLE METHOD
A total of 961 branches were sampled for epiphytes and structural measurements.
The crowns of small trees were accessed using ladders, while the large
and medium trees required use of the canopy crane. The different access
techniques required minor variation in the methods used for sampling branches.
Small trees- All live branches >2mm diameter and all dead branches
>10 mm were sampled, although only live branches were used in the analyses.
Medium and large trees- A subsampling of only live branches was performed
on
these trees resulting in approximately 30 sampled branches per tree. The
branch sampling consisted of "vertical drops" of the crane gondola.
Vertical drops were done on 2-4 sides of each tree crown depending on
accessibility. For each vertical drop the crane gondola was positioned
above an area of the tree that appeared accessible from the top to the
base of the crown. The gondola was then lowered at 2m (medium trees) or
3m (large trees) intervals and the nearest live branch within 30 degrees
to either side of the gondola was selected for sampling. If no branch
was present, the gondola was lowered to the next stop. This procedure
continued throughout the length of the tree crown, or until further downward
movement was obstructed by foliage, branches, or snags.
For each branch the following structural measurements were made: branch
diameter, branch height (at base and tip), branch length, and foliage
length. On small trees branch aspect was recorded. On large and medium
trees the "angle to the crane tower" was determined.
The AllBranches table:
This table lists data for each sampled branch on the thirty trees in the
study. This table contains data for ALL sampled branches.
Trees are referenced by TREETAG.
Each sampled branch on each tree is given an identifier unique within
that tree (BRANCHNUM).
To refer to a specific branch, one must give both the treetag and the
branchnum. (27.11 refers to tree 27, branch 11, for example.)
BOLETOTIP is the horizontal distance from the bole of the tree to the
tip of the branch, in meters. Note that this is not the length of the
branch, but how far out the branch extends from the stem.
(ht class 1 method: measuring tape. Precision: mm
ht class 2,3 method: expandable measuring pole. Precision: cm)
FOLTOTIP is the horizontal distance from the start of the main mass of
foliage to the tip of the branch, given in meters.
(methods same as BOLETOTIP)
BRDIAM is the diameter of the branch at its base, in centimeters.
(ht class 1 method: caliper. Precision: mm
ht class 2,3 method: visual estimation with measuring stick. Precision:
.5 cm)
Comment is a comments field.
The SmallTreeBranches table:
This table lists data gathered from ht class 1 trees only.
TREETAG.BRANCHNUM as AllBranches (above)
BRHEIGHT is the branch height at the base of the branch in meters.
FOLHEIGHT is the height of the branch at the tip of the foliage in meters.
(method: measuring tape. Precision: mm)
ASPECT is the direction of the tip of the branch measured with a compass
in polar degrees (0=north). Precision: 1 degree
The CraneBranches table :
This table lists data gathered from ht class 2 & 3 trees using the
crane.
TREETAG.BRANCHNUM as AllBranches (above)
HOOK, ADJUSTBR, ADJUSTFOL
These three values are used for calculating height of branch base and
foliage at tip.
HOOK is a reading from the crane operator that measures the amount of
cable let out as the gondola is lowered plus the distance to the gondola
railing.
ADJUSTBR is the height of the branch above or below the gondola railing.
ADJUSTFOL is the height of the foliage above or below the gondola railing.
The following formula estimates the height by subtracting the adjusted
HOOK distance from the height of the crane tower:
(69-(HOOK -adjustment)-Z)
where Z is the ground elevation of the base of the stem in relation to
the crane base in meters.
EXAMPLE: If the stem base is 2 meters higher in elevation than the crane
base, Z=2.
Precision of resulting branchheight, folheight using this method: unknown,
+-1 meter?
The ANGLE from the crane tower to the center of the tree was measured
with a giant protractor. Readings were taken down the length of the branch
facing the tree with the zero position of the protractor always pointed
towards the crane. Angles were measured in a clockwise manner. This was
done because compasses don't work in the gondola. Precision: +-10 degrees
The following formula for converting ANGLE to ASPECT was never tested
or confirmed.
If the tree in question is East of the crane (X>5.8):
ASPECT= 90+(Arctan([P])*((4*Arctan(1))/180))+[ANGLE]
If West of the crane (X<5.8):
ASPECT= 90-(Arctan([P])*((4*Arctan(1))/180))+[ANGLE])
Where P is the position of the tree relative to the crane: (3.36-[Y])/(5.8-[X])
QUADRAT METHOD
Definition: A quadrat is an area of the branch defined by a rectangular
quadrat frame.
Epiphyte functional groups were sampled with a quadrat frame at 3 positions
(inner, middle, and outer) along each branch. The inner region was defined
as the area of bare branch, prior to the onset of foliage. The middle
and outer regions were located within the foliated section of the branch.
For the middle quadrat position the quadrat frame was placed approximately
10 cm beyond the onset of foliage, and for the outer position the quadrat
frame was placed approximately 10 cm inward from the branch tip. See figure
1.
A PVC quadrat frame was placed at each branch position, laid flat, and
the percent cover of each epiphyte functional group was estimated. A 10
x 25 cm frame was used for small trees, while a 20 x 50 cm frame was used
for medium and large trees. Each frame was subdivided into 10 sections,
each section equaling 10 percent of the surface area of the frame.
The size of branches varies considerably within a single tree, so in many
cases only a portion of the quadrat frame was utilized. In these instances,
the percent of the entire quadrat that was actually used was recorded
as QUAD%. Then, the percent of the foliage and branch material within
the utilized region of the frame was recorded as FOL%. This was done in
order to estimate the actual surface area that was present at each position
throughout the tree. Adjustments were made to estimate what percent of
the available surface area was colonized by epiphyte functional groups.
Details of the adjustments are given in the epiphyte and percent cover
methods.
The Quadrat table:
Each row in this table contains information about a single quadrat.
TREETAG.BRANCHNUM as in AllBranches
POSITION has three possible values, INNER, MIDDLE or OUTER. (Described
in the method above)
To refer to a specific quadrat, it is necessary to give the treetag, the
branchnum, and the position. (27.11-OUTER refers to tree 27, branch 11,
outer quadrat, for example.)
QUAD% The percent of the quadrat frame used (in cases when the frame was too large for the branch).
FOL% The percent of the quadrat frame containing foliage and twigs. Obviously, Inner Quadrats have no foliage % value.
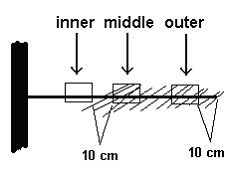
figure 1- diagonal lines are foliage, rectangles are quadrats
EPIPHYTE PERCENT COVER METHOD
The percent cover of epiphyte functional groups was sampled at each of
three quadrat positions. Only the upper surfaces of live branches were
sampled for epiphytes. Within the inner quadrat positions (defined as
the region of bare branch before foliage) epiphytes were sampled up to
the length of the quadrat frame. In cases
where the inner sampling region was shorter than the length of the quadrat
frame, the entire upper surface area was sampled. In the upper region
of the tree crowns foliage often extended along the entire branch surface
so in effect there was no inner quadrat. The middle and outer quadrats
were always placed over foliage, so the percent of foliage and associated
branch material was recorded and used to determine the actual surface
area. On the smallest branches within trees crowns, only a portion of
the quadrat frame was used so this percent was stored as QUAD% (see description
of the quadrat table, above).
The relative (or "adjusted") percent cover is defined here as
the amount of available substrate covered by epiphtyes and is calculated
as shown below.
1.Epiphyte surface area: (percent epiphyte cover)/(size of quadrat frame)
2.Available surface area: [(percent quadrat/100)(size of quadrat frame)]x[percent
foliage/100]
Dividing equation 1 by equation 2 and simplifying results in the adjustment
formula:
[percent epiphyte cover /{quadratPercent x (foliagePercent/100)}] x 100.
The Epi% table:
This table contains the raw epiphyte abundance estimations.
TREETAG.BRANCHNUM,POSITION as reference to a quadrat.
FUNCGROUP specifies the functional group being estimated. Descriptions of the possible values are below.
COVER% (or "percent epiphyte cover") is the estimated percent
cover of the specified epiphyte functional group. A value of 0 represents
absence of the functional group. A null value means that the corresponding
quadrat position does not exist (usually inner). To reduce file size,
these values were not included in the excel spreadsheet.
Precision: unknown, perhaps +-5%
The Epiphyte Functional Groups (table EpiFunc):
FUNCGROUP DESCRIPTION
ALECT Alectoriods
BRYO Bryophytes
CLADONIA Cladonia sp.
CYANO Cyanolichens
OTHER Other Lichens
SPHAER Sphaerophorus globosus
TOTAL Total cover of all epiphytes