THE WHOLE BRAIN ATLAS LAB
The purpose of this lab is to familiarize you with structures of the human brain as visualized in virtual sections created with modern imaging techniques. As you go through this exercise, you should compare what you see with brain structures you saw during your work with the sheepís brain exercise.
Go to the Whole Brain Atlas site and use the features there to work through the exercises below.
1. Read the Neuroimaging Primer. Page 1 will help you familiarize yourself with brain imaging technology.
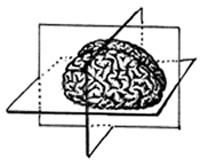
2. Label the standard planes of imaging on the diagram below.
3. Read "More Details of MR" to learn about image types and signal sources.
b. Are they the same or different for different soft body tissues?
c. Why is this important?
d. What factors affect the strength of the MR signal?
e. Note the left-right convention used in MR images. Which side of each
image shows us the left side of the brain?
f. What does "MR" stand for?
4. Read the page on Basic MR Imaging. How does increased tissue water (as might result from edema -- that is, swelling) appear in MR images? How does infarction (dead tissue caused by vascular blockage) appear in MR images? How does inflammation (caused by infection or hemorrhage) appear in T1 weighted MRI: bright or dark?
b. How does fat appear in T1 weighted MRI?
c. How does fat appear in T2 weighted MRI?
d. What major regions of the brain contain high quantities of fat?
5. Using Page
2 of the Neuroimaging Primer, fill in the table below for normal tissue:
|
|
|
|
|
| Dense bone | |||
| Air | |||
| Fat | |||
| Water | |||
| Brain |
Why is the image of the brain given by MR1 called "anatomic?"
Fill in the table below for abnormal tissue:
|
|
|
|
|
|
| Infarct | ||||
| Bleed | ||||
| Tumor | ||||
| MS plaque | ||||
| *Enhancement refers to whether the chemicals used to reveal leakages in the blood/brain barrier (gadolinium for MRI and iodine for CT) will show such leakage. | ||||
a. How can you know what level in the brain the current slice is from?
b. How can you tell what types of image of this brain are available
and which one you are looking at?
c. What do the T-shaped "ticks" on the lower lines of the bottom graphic
mean?
Note: SPECT T1 is PET with Thallium 201, a potassium analog compund which reveals blood/brain leakage. SPECT TC shows overall brain perfusion.
7. Go to the Atlas
of Top 100 Brain Structures. Look up the following structures and fill
in the table.
|
|
|
|
|
|||||||
| Superior temporal gyrus | ||||||||||
| Central sulcus | ||||||||||
| Precentral gyrus | ||||||||||
| Postcentral gyrus | ||||||||||
| Sylvian fissure | ||||||||||
| Basal ganglia (head of caudate) | ||||||||||
| Basal ganglia (putamen/globus pallidus) | ||||||||||
| Corpus callosum | ||||||||||
| Hippocampus | ||||||||||
| Angular gyrus | ||||||||||
| Fornix | ||||||||||
| Cingulate gyrus | ||||||||||
| Amygdala | ||||||||||
| Thalamus | ||||||||||
| Pineal gland | ||||||||||
| Superior colliculus | ||||||||||
| Inferior colliculus | ||||||||||
| Pons | ||||||||||
| Medulla | ||||||||||
| Cerebellar hemispheres | ||||||||||
| Optic chiasm | ||||||||||
|
|
||||||||||
8. Return to the Whole Brain Atlas homepage and find the following pathological examples.
a. Acute
stroke: speech arrest. Take the tour, read the clinical report (follow
the link at the bottom of the page) and answer these questions: Where is
the lesion? Which types of image show the lesion most effectively?
b. Acute
stroke: fluent aphasia. Where is the lesion?
c. Glioma
(a malignant growth of the supporting, non-neuronal cells of the brain).
Take Tour 1 and read the clinical report. Where is the lesion? What type
of imaging is used for Tour 1, and why?
Look at some of the slices with SPECT TC (this image shows blood flow
perfusion), and SPECT T1 (shows blood/brain barrier leakage). What do the
two images reveal about the effects of the tumor on the brain?
d. Alzheimer's
Disease. Take Tour 1 and look at the SPECT TC and MRI images. What
are some of the differences between this brain and a normal aged brain?
What part of the brain is most severely affected in this patient?
If you have time, you can also look at the Alzheimer's Visual Agnosia
brain -- what differences do you notice between the two Alzheimer's brains?
e. Huntington's Disease. Read the clinical report. Compare this slice with the normal brain at the same level. What differences do you see? (Note: use the small image in the lower left and note the level of the yellow line on a prominent brain structure and match this on the normal brain. The slice numbers are not comparable between pictures!)