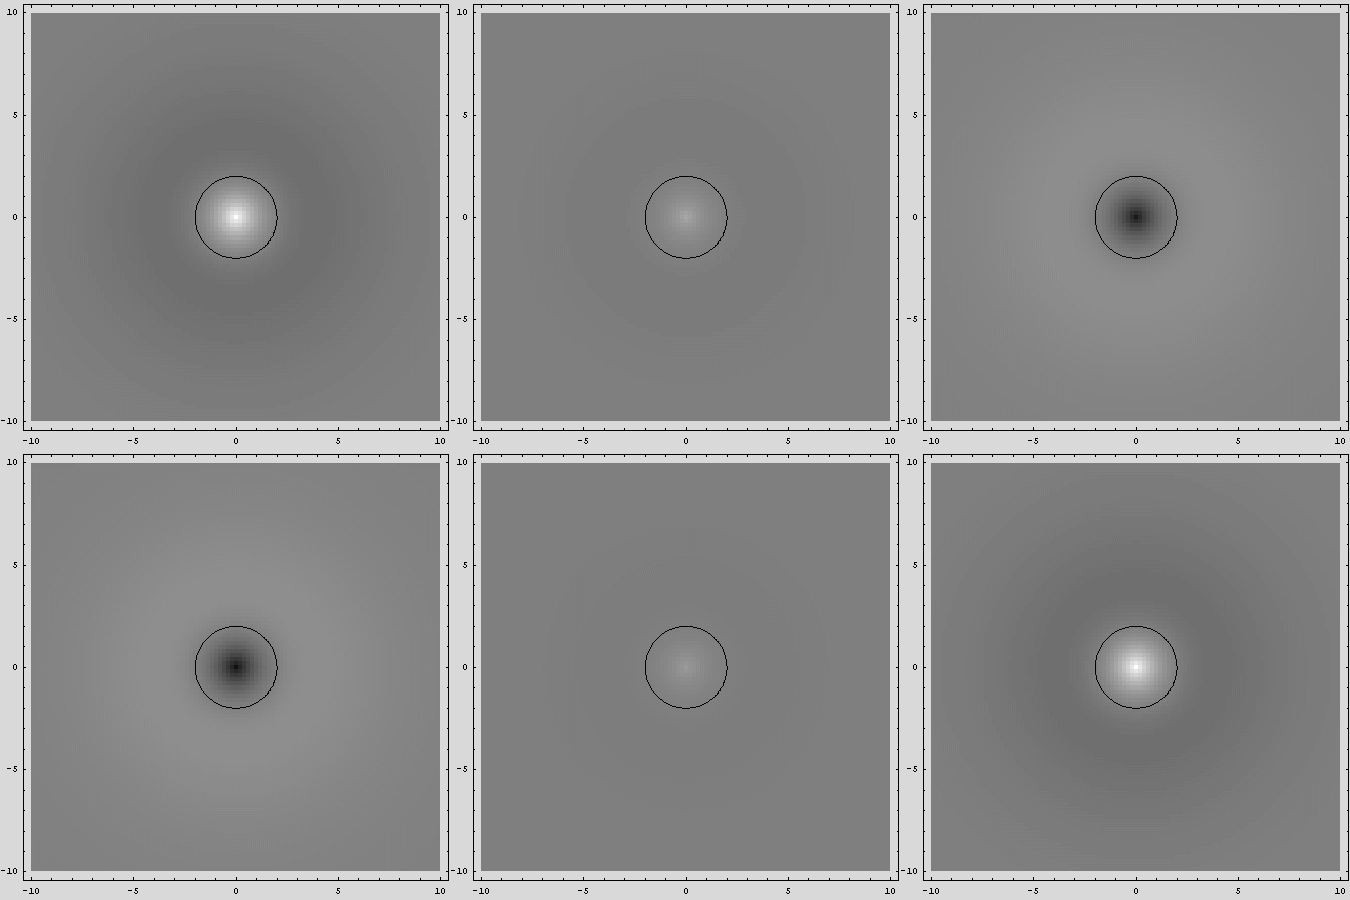
Distances are in Bohr radii (0.592 angstroms).
Density Plot Animation of the 2s Orbital Wavefunction
The density plot uses a gray scale to indicate wave amplitude. Light shades represent positive amplitudes and dark shades indicate negative values. The node in the wavefunction, where the amplitude is always zero (at a radius of 2 Bohr radii) is indicated by the solid line.

Distances are in Bohr radii (0.592 angstroms).
Return to Matter
& Motion homepage
Return to Evergreen
homepage