![]()
Chemistry Lab 2 - Entropy and Enthalpy Changes in a Ligand Exchange Reaction
January 16, 2001
Purpose. In this lab you will measure the equilibrium constant of a ligand exchange reaction at several temperatures. By plotting ln K vs. 1/T, you will get values for DH and DS of the reaction.
Introduction. One of the interesting aspects of the chemistry of transition metals is the beautiful colors many of their compounds. For example, the colors of gem stones are frequently due to the presence of transition metal ions. Iron is responsible for the characteristic colors of aquamarine, citrine and garnet, whereas chromium (III) gives rise to the red color of rubies as well as the green color of emeralds. An immediate question comes to mind - How can the same ion, chromium (III), give rise to the very different colors of rubies and emeralds?
The color of a particular ion depends not only on the ion itself, but on what species are in direct contact with it, as well as on its geometry. As a result, reactions of transition metal complexes often result in color changes since the chemical environment, i.e., the "neighborhood", of the transition metal is different in the product than it was in the reactant. The subject of today's lab is a classic example of such a reaction and is shown below.
[Co(H2O)6]2+ (aq) + 4 Cl- (aq) « [CoCl4]2- (aq) + 6 H2O (l)
In this reaction, the Co2+ ion in solution does not exist as a simple monatomic species. Instead, it is chemically bonded to six water molecules in an octahedral arrangement. In this form, the color of the cobalt is a pale pink. In the presence of chloride, however, this complex is in equilibrium with another cobalt species, one that is bonded to four chloride ions with a tetrahedral geometry. This species is a much deeper blue color. In this reaction, the water and the chloride ions, when bound to the cobalt, are called ligands and the overall reaction is called a ligand exchange.
The dominant form depends on the temperature of the solution as well as on the concentration of chloride present. The equilibrium expression for the reaction is:
![]()
The reaction as written is endothermic, that is, more energy is required to break the six water-cobalt bonds than is released by the formation of four cobalt-chloride bonds. However, this reaction results in a net increase in the entropy of the system (why?). Thus, it is an example of a reaction with a positive DH and a positive DS. It will therefore become increasingly favored at higher temperature. The goal of this experiment is to examine this reaction and determine the values of DH and DS.
The relationship between the equilibrium constant, K, and the change in free energy, DG° is:
DG° = -RT ln K
Here R is the gas constant and T is the absolute temperature. From the definition of Gibbs Free Energy the following can be written:
DG° = DH° - TDS°
![]()
Clearly, DG°
is a function of temperature and the above expression indicates that a
plot of ln K vs. 1/T should yield a straight line with a
slope of -DH°
/R and an intercept of DS°
/R. This assumes that neither DH nor
DS
is a function of temperature and, under the conditions we will be employing
in this experiment, this is a good approximation.
We will be measuring the value of the equilibrium constant
spectrophotometrically. Since the two different forms of the cobalt have
very different colors, it should be possible to determine the concentrations
of each form by their absorbances using Beer's Law, A = ebc.
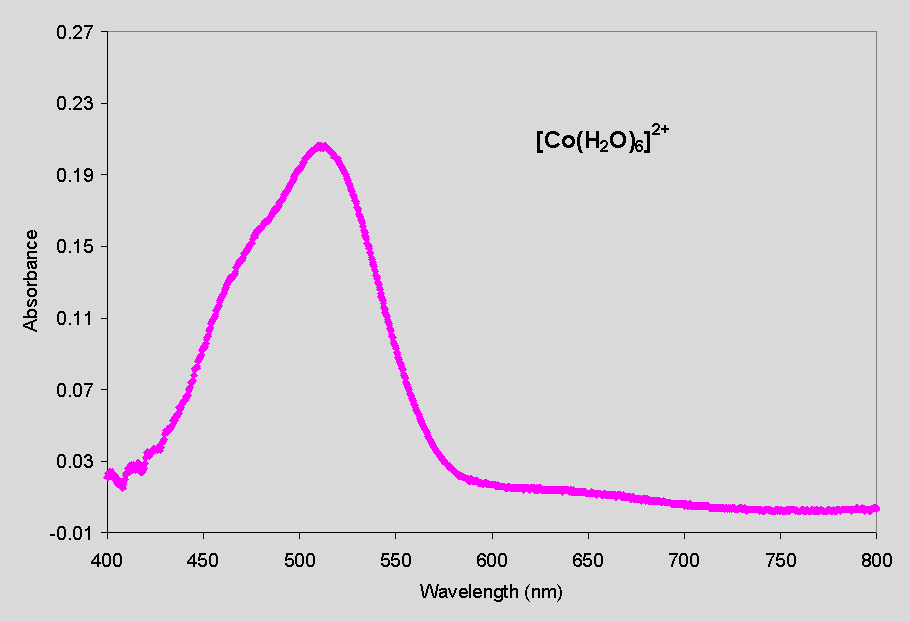
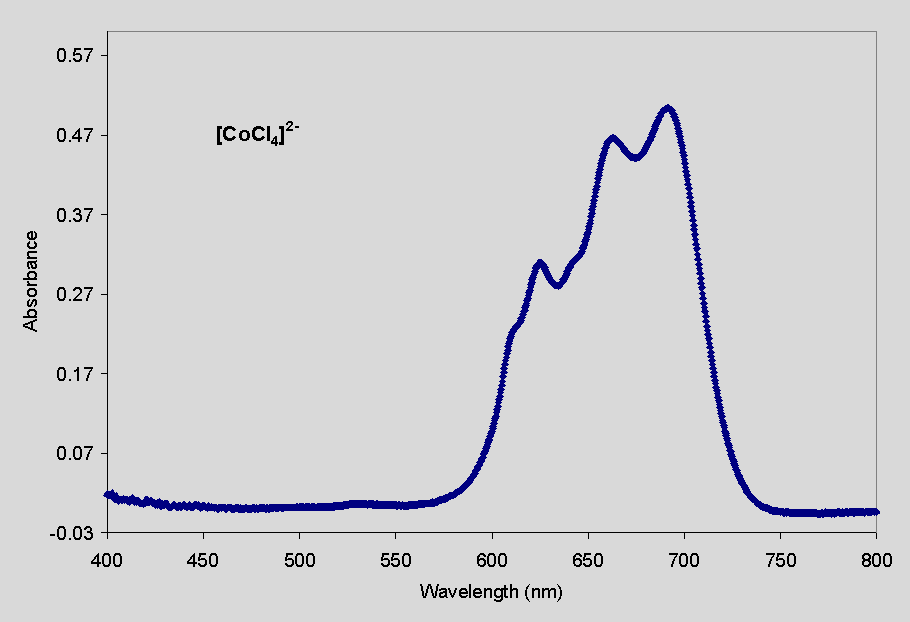
The visible spectra of each compound is shown below. Note that the molar
absorptivity, e, of the chloride complex is
much greater than that of the aquo complex, that is, it absorbs light much
more efficiently. Because of this fact, a small amount of the [CoCl4]2-
has a dramatic influence on the appearance of the solution. You will see
this in the experiment. In fact, the difference in absorptivity of these
two species is so great that to obtain measurable signals of both forms
in the same experiment is not possible. We will therefore be following
the equilibrium by directly measuring the absorbance of CoCl42-;
the concentration of Co(H2O)62+ will be
found by difference.
 |
 |
| Figure 1. Absorbance spectrum of a 0.0425 M solution of [Co(H2O)6]2+ in water. The absorbance has a maximum value at 511 nm (e = 4.85 L mol-1 cm-1). | Figure 2. Absorbance
spectrum of a
8.80 ´ 10-4 M solution of [CoCl4]2- in concentrated HCl. The absorbance has a maximum value at 692 nm (e = 572 L mol-1 cm-1). |
Procedure. Working in teams of two, follow the procedure as outlined below. Use an Ocean Optics fiber optic spectrometer to measure the absorbance of your cobalt solutions.
1. Weigh out approximately 1.9 g [Co(H2O)6]Cl2 (record mass to the nearest 0.0001 mg) and transfer to a 50.00 mL volumetric flask. Pour about 25 mL of 4.0 M HCl and swirl to dissolve. Fill to the mark with additional 4.0 M HCl. Note the color of the solution in your notebook.
2. Place a 400 or 600 mL beaker, about 2/3 full with hot water from the tap, on a hotplate. Heat with a medium setting. Transfer some of your cobalt solution to a test tube. Wrap the top with parafilm to prevent evaporation of water from the test tube. Place the test tube in your hot water bath. Measure the temperature with a digital thermometer. Note any changes in the appearance of the solution as the temperature rises.
3. As the temperature is rising in the beaker, get ready to make absorbance measurements on your spectrometer. Measure a "dark" background and a "light" background as instructed in the instrument handout. Use water as your solvent background when making the "light" background measurement. Put the instrument in "absorbance" mode and place the vertical cursor at 692 nm.
4. When the temperature of the hot water is about 90° C, use a pair of tongs to hold a cuvet about 3/4 submerged in the water to allow the walls to come to thermal equilibrium. Then, using a disposable pasteur pipet, transfer about 3 mL of your cobalt solution to the cuvet while holding the cuvet in the water (do NOT allow water from the bath into the cuvet). Re-wrap the test tube and place in a beaker at room temperature.
5. As quickly as possible remove the cuvet from the water bath, wipe the windows and place in the spectrometer (in absorbance mode). Use the digital thermometer to measure the temperature of the solution. Record the absorbance of the solution at 692 nm. As the solution cools, continue to record the temperature and absorbance at roughly 5° C intervals. Make sure the thermometer is not blocking the light beam as you make absorbance readings. When the solution temperature has fallen to about 30° C, begin gradual cooling in an ice bath. Place the cuvet in an ice bath and allow the temperature to fall about 5° C. Wipe the sides and measure the absorbance. If bubbles form on the inside walls, use the thermometer to gently clear them. Repeat until the temperature falls to around 10° C. At the final temperature, also record the absorbance of the [Co(H2O)6]2+ complex at its maximum wavelength, about 512 nm.
6. Repeat the above procedure and get a second set of absorbance and temperature measurements. If for whatever reason, the first attempt fails, continue working until two sets of data, spanning at least 10° - 60° C is obtained.
Treat your data sets independently. Enter your data in two columns in a spreadsheet. Your goal is to plot ln K vs. 1/T (remember to use the absolute temperature). To determine K, you need to calculate the concentrations of all species that appear in the equilibrium expression. Do this as follows:
*Note that this approach assumes that the concentration
of [Co(H2O)6]2+ does not change. While
this is not true, the relative change in concentration is small enough
that it does not introduce significant error.
[Co(H2O)62+]: Use the total cobalt concentration of the solution and the concentration of the CoCl42- to calculate [Co(H2O)6]2+ by the following equation:
[Co2+]total = [CoCl42-] + [Co(H2O)62+]
[Cl-]: Assume this to be 4.0, the molarity of the acid solvent, at all temperatures, i.e., assume that the change in chloride concentration is negligible as the reaction progresses.
Repeat the analysis for your second data set.
Report. Put both graphs along with the resulting
DH
and DS values into your notebook. The graphs
and calculations will be due on 1/23.