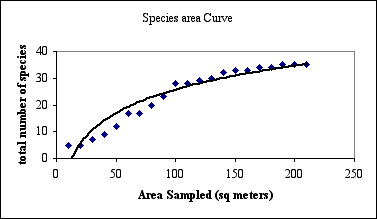
 For example, in the "fake"
curve at the right, somewhere around 200 m2 is the area to sample.
T3 Fall 2001
Species Area Curve
One of the questions that needs to be addressed in any field study is "How much area should we sample?" Ideally, we would like to study all the individuals, but time and funds usually limit the scope of the samples. One way of answering this question is to sample a number of small plots and identify the species present in each plot. A cumulative count of the species can then be tabulated and the sampling continues until no or "hardly any" new species show up.
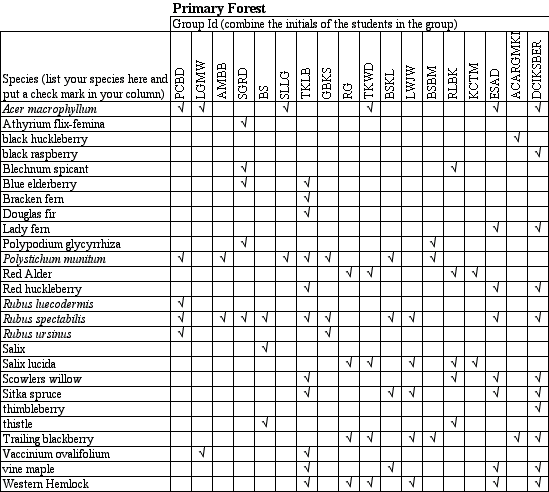
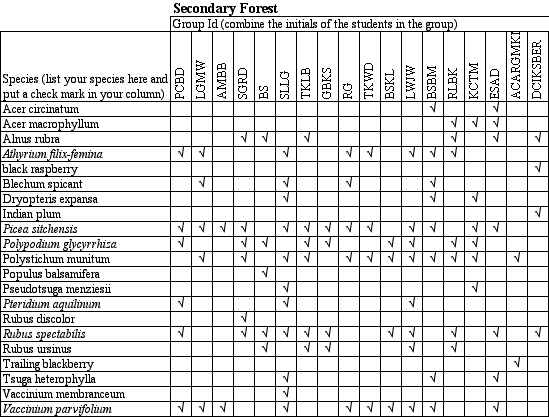
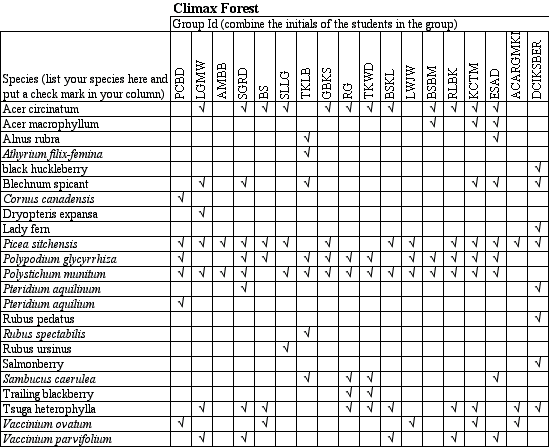
You took a number of sample plots in the Hoh valley on the field trip. Each plot was 10 m2. Your job with this data is to construct a species/area curve for each forest, with total area sampled on the x-axis and total cumulative number of species found on the y-axis. The total cumulative number of species IS NOT a count of the number of checkmarks in each column and adding them up. Each species is counted only once. For the first plot, the total number of new species is a count of the checkmarks. For the second plot, you count only the new species that were not in the previous plot and add those to the total number of species found. For the third plot, again you count only the new species that have not been found in any of the previous plots and add those to the total. With each additional plot the number of new species will diminish. When the line flattens out, it indicates that you sampling enough area to get most of the species present.
 For example, in the "fake"
curve at the right, somewhere around 200 m2 is the area to sample.
Task
Read through to the attached directions and work through the examples. Then substitute Red alder for species A and Sword fern (P. munitum) for species B. Look at each sample plot and classify the plot by whether if they have: (a) both present in that plot, (b) sword fern present and alder absent, (c) alder present and sword fern absent, or (d) both absent. Do this for each plot for all three forest types and add together the number of plots in each category. This creates your contingency table. Work through the calculations, first go through the worked example given and then with your numbers. Do a chi square for 1. red alder/sword fern, 2.Rubus spectabilis/ Sitka spruce (be aware that Sitka spruce is under its Latin name in one forest data set), and 3. one other pair of plants. The critical value for chi square is 3.841 (1 degree of freedom, 5% significance). If your calculated chi square is greater than 3.841 then you have an association between the plants, otherwise you must conclude that there is no association.
Q2. For each pair of plants, give the chi square value and interpret
the results.
Writeup
You and your lab partner (two people only) need to turn in the species area curves for all three forests, answers to any questions, and the chi square results.


