Patterns Across Space and Time
Mathematica Workshop
Exploring Wave Superposition with sounds
Sound waves are complex wave phenomena. In this workshop you will explore how the principle of linear superposition works generate sound waves.
Getting sound out of your computer
- First in your Mathematica worksheet define a sinusoidal wave function which has frequency f as a variable that can be chosen later.
wave[f_]:=Sin[2*Pi*f*t]
The syntax is important. Mathematica complains if you mistype.
- Now plot this function with a frequency =440Hz which corresponds to the note "A" on the piano for a time interval t=0 to 0.01 seconds. (How many periods is this time interval?).
Plot[wave[440],{t,0,0.01},PlotStyle->Hue[0.85],AxesLabel->{"t","Amplitude"}]
Make sure you are clear about what each part of this command does experiment a bit by changing some of the values.
- Now that you have a visual image of this wave, lets hear what this wave sounds like. The Play function is used to make sounds. It has a similar format as Plot. Play this wave for 0.5 second interval with =440 Hz,
Play[wave[440], {t,0,0.5}, SampleRate->11025]
SampleRate is the number of samples per second that are used to digitize the sound. This should be significantly higher than the frequency or else the sound quality is poor. If you want to hear the sound again double click on the plot.
- Experiment with Plots and Plays of waves with different frequencies and see how the plots and sounds change.
Combining Sounds
The sound from a musical instrument is typically a combination of waves with different frequencies. In the next few examples we explore a variety of different phenomena that can arise when sound waves combine
Beats
The first topic in sounds is beats. As demonstrated in workshop, when two waves of similar frequency play together an undulating sound called beats can be heard.
- Plot the sum of the two waves with frequencies =440 and =480 Hz for a time interval of 0.05 s.Comment on the shape of the wave.
What is the time between beats, and hence what is the beat frequency.
What is the underlying period and frequency of the sound wave itself.
- Next, play the beating waves for 1 second. Do you hear beats? If not why not?
- Now play the combination of waves with 1=440 Hz and 2=444 Hz, for 1 second. This time the beats should be audible. What is the approximate frequency of the beats? Change the value of the second frequency f2 to see how the beats change as you make 2 closer to or farther from 1. Comment on your results by noting which frequencies you chose and what beat frequency you observed.
Carrier wave
Another important music phenomenon is the "carrier wave". Here, two waves of very different frequency interact.
- First, make a plot of a combination of two waves with frequency =10 and =100 Hz over a time interval of 0.5 seconds Notice how the high frequency wave "carries" the modulation of the low frequency wave. This is the way an AM radio (amplitude modulation) works. A high frequency carrier wave (around 1 MHz) is modulated with a low frequency sound wave. The high frequency wave is your radio station. The radio detects the high frequency wave and subtracts it, leaving the sound wave, which is played on your speaker. Play this combination of waves for 1 second and carefully record what you hear in your notebook
- Now plot a combination of two waves with frequency of 440 Hz and 4440 Hz for an interval of 0.01 seconds. Then play the sum of these waves for 1 second. Do you detect one frequency with modulated amplitude as the plot suggests or do you detect two separate notes? Explain.
Harmonics
The sound produced by many musical instruments, such as stringed instruments or simple wind instruments consists of a wave with a fundamental frequency (corresponding to the note that was played) with additional waves with harmonic frequencies which are an integer multiple of the fundamental frequency. There can also be overtones which are not simply related to the fundamental. These
overtones and harmonics are what make a particular instrument have its distinctive timbre. To see how harmonics affect the shape of a wave, plot the sum of a wave with fundamental frequency (or first harmonic) =440 with the second harmonic f =880 Hz for an interval of 0.01 s. Then play this combination for 1 second. Compare the difference between this sound with that consisting of just the fundamental frequency.
Constructing Sound Waves
To produce a sound that mimics the sound of a musical instrument more harmonics must be included and the amplitude of the different waves is generally different. For example the following combination of waves produces a plot which looks somewhat like the sound wave produced by a saxophone playing "A". Notice how the third harmonic with frequency 1320 Hz is actually missing.
Plot[wave[440]+0.1*wave[880]-0.4*wave[1760],{t,0,0.1},PlotStyle->Hue[0.85], AxesLabel->{"t","Amplitude"}]
- Plot this wave combination. Now play this wave combination for 1 second. Does it sound like a saxophone? To get a really good replication of the sound many more harmonics must be added
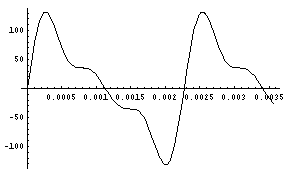
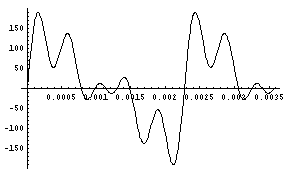
- The following graphs show the sound waves for a clarinet and a trumpet playing an A note with fundamental frequency 440 Hz. See if you can reproduced these graphs by adding different harmonics. This will take some trial and error.
Clarinet

Trumpet

There is a way to determine the correct combination of frequencies and amplitudes that make up a sound wave. This process is called Fourier Analysis or Spectral Analysis. Mathematica can do this for you, however the process is a bit cumbersome. There are better software applications that can do this. One of these is SpectraFoo which you will be working with next week.
For Whom the Bell Tolls
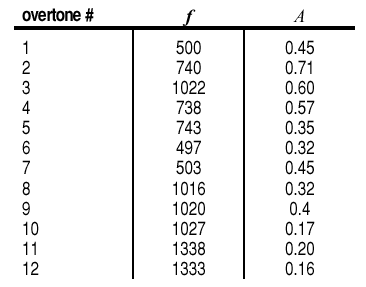
Fourier Analysis was performed on the following on the sound of a bell
the first 3 "harmonics" of a bell: 500, 740, 1022 Hz. Notice that the fundamental frequency is acutally missing! (What, approximately, is the fundamental frequency?) Also notice these are only approximate harmonics. This is particularly comment in drums and bells.

- Below is a list of the main overtones and amplitudes for a bell. Construct a plot of the sound made by combining these overtones with the correct amplitudes
- Now play this sound. Does it sound like a bell?
Creating Music
- Create a sound by combining a wave with fundamental frequency and its harmonics and with amplitudes of your choosing. If you like you can allow the amplitude to diminish with increasing frequency according to some mathematical relationship, or you can play around until you get a tone with a pleasing timbre. Save this as a sound file by exporting as a wave file. The filename should be your last name.

- As an experiment create sounds which involve a product rather than a sum of sine waves. For example try

- Also Try using the Play comment to hear what other functions sound like. For example.

- Explore the Mathematica Sound Gallery (in the help browser) to see other functions you can use to play sound
Important
Copy your complete Mathematica notebook and your sound files to the MathematicaProject directory in the Patterns directory.


