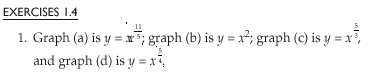
Week 2 Math Homework Solutions
EXERCISES 1.3
3. Yes, there is a linear relationship. There is a constant slope
of 0.5 between all data pairs.
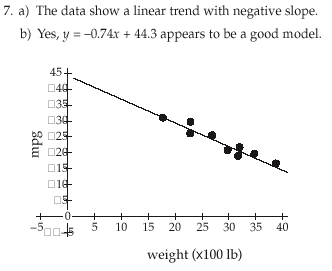
c) The slope tells you that, on average, for every increase
of 100 pounds of car weight, the car will lose 0.73 miles
per gallon in city mileage. The y-intercept of 44.3 says
that if a car weighs zero pounds, it will average 44.3
miles per gallon of gas. In this context, the y-intercept
is meaningless.
d) The answers will vary depending on what a student
feels is the weight of a very small car and a very large
one. One reasonable answer might be between 1000
and 5000 pounds. The range would then vary from
f(10) to f(50) or between approximately 37 and 7 mpg.
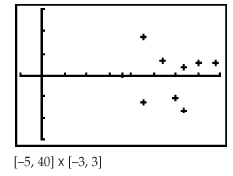
e) Yes, the equation y = 0.74x + 44.3 appears to be a
good fit since the residuals are randomly scattered
with no apparent trend or pattern and are reasonably
small.
10. a) Using 1990 as year 0: (0, 442.2), (8, 158.5)
y = 35.46x + 442.2
b) More than likely what will happen in the future is that
sales of cassettes will decline and sales will level out.
It will probably never be zero sales. The linear model
predicts that in year 12.5 (2002), no cassettes will be
sold.
14. The correct function is (b) because it is the only one that
gives the correct values. For example, after 2 hours, the
vehicle has traveled 30 miles the first hour plus 65 miles
the second hour, for a total of 95 miles. Substituting 2 in
quation (a) gives 130 miles. Substituting 2 in equation (b)
gives 95 miles. Substituting 2 in equation (c) gives 160
miles.
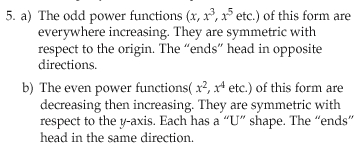
8. All functions are decreasing, concave up, and pass
through the point (1, 1). None have intercepts.
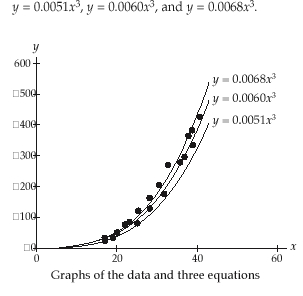
15. a) Answers will vary depending on the value of A used.
Following are three sample answers, one using an
ordered pair associated with the group of smallest
diameters, a pair near the middle of the data, and one
near the upper end:
Using (19, 35), A =0.097
Using (28, 150), A =0.191
Using (39, 358), A =0.235
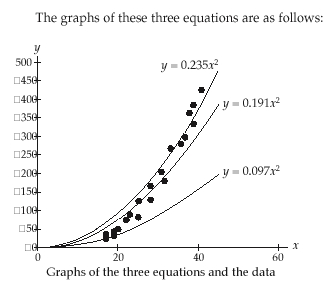
Another possibility is for students to use the average of
the ratios for A = 0.177.
The value of A makes some difference in the fit of the
data, but, each leaves a clearly increasing pattern, so
no matter what A is chosen, a second-degree power
function does not produce a good fit.
b) Since residuals are increasing, move up the Ladder of
Powers to find a curve that increases more rapidly.
c) The same ordered pairs as in Exercise 15(a) were used
to calculate three possible values for A. The following
graphs show the functions for