Simple Circuits and Oscilloscope
Today’s lab continues our work with simple circuits, taking up voltage. Your goal should be to predict and verify the behavior of circuits involving batteries and ohmic resistors. You will also investigate the current-voltage relationship for one or two common non-ohmic items, such as a light-emitting diode (LED).
Background: From the previous circuits lab, you should have some understanding and intuition about relative amounts of current flowing through simple circuits involving up to four light bulbs, and you have used the ammeter settings on a digital multimeter. You have read Moore’s chapter E6, “Analyzing Circuits,” and have begun to understand how to predict what voltage differences exist between different points in a circuit, and what currents will flow in different branches.
Part I: Voltage and Resistance (required)
First, gather equipment—
|
2-4 D cell batteries |
1 “Quad” power supply |
|
1 multimeter |
numerous wires with alligator clips |
|
sample of 10-100 ohm resistors |
|
—and (a) get familiar with the voltmeter settings of the multimeter, following the brief pre-lab demonstration,
(b) join with another lab group to use one group’s meter to measure the current flowing through the other group’s meter when it is set for voltage. (caution: don’t connect both meters when on ammeter settings, unless you have resistance in the circuit: you are likely to blow the ammeter fuses, and it is a hassle and a delay to replace them.),
(c) see if the voltages between any two points in a four-battery string (not connected to any circuit) are what you would predict from a “roller-coaster” picture of battery action (see section E6.1 in Moore),
(d) use the voltmeter to see the effects of the controls and settings on the “Quad” power supplies available,
(e) use the ohmmeter setting of the multimeter to measure the resistance of some of the resistors, and compare with the ratings as given by the color codes they carry.
Next, construct a number of circuits involving resistors in various configurations, predict the voltage difference between any two points and the current flowing through any element, and then verify those predictions. Work up from one-element, to two-, three-, and ultimately four-element circuits. Be sure you can do this for the following two circuits:
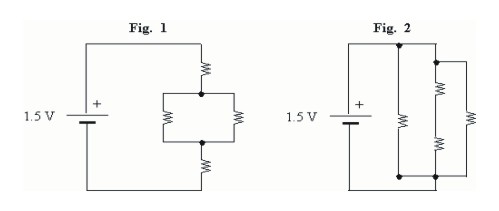
When ready, summon Rob, Laura or Jenna, and demonstrate your calculation, one of these circuit layouts, and your result. We may ask you to do prediction, setup and measurement for a circuit of our choosing, from this general family of four-element circuits. We will also ask you how to set up a circuit that guarantees that no more than 20 mA will flow through the LED (light-emitting diode) we will give you.
Finally, make a series of measurements to establish the voltage-current curve of the LED. If this were an ohmic device, the curve would be a straight line (V = RI), with R, the resistance, as the constant of proportionality between I and V. But the LED is not ohmic. Define the relation as a data table and graph. (Do not worry about finding a simple function which describes it.)
Note: For those who like web-based references, here is a handsome real-time decoder for resistor color codes: you choose the colors, and it not only gives the rated resistance, but gives you a fine large portrait of the resistor in question, presumably so you can compare it with the only you are looking at:
http://www.electrician.com/resist_calc/resist_calc.htm
And there’s a hint about the current-limiting circuit at http://www.makegizmos.com/ledlight.htm
Report: Sketches and calculations for all circuits you studied, and LED current-voltage relation, al explained in good prose.
Part II: Oscilloscope (optional)
The
basic components of an oscilloscope are four:
•
an "electron gun," which generates a small, tightly focused beam of
electrons
•
a fluorescent screen, which glows at any point the beam strikes
•
two sets of deflection plates which alter the beam's course on its way
to the screen.
These components
are housed in a long vacuum tube, and packed into a housing along with a power
supply and a number of auxiliary circuits. We will go over the diagram,
translating the terms from French one by one.
The
deflection plates are arranged to move the beam horizontally and vertically on
the fluorescent screen, so the screen functions like a sheet of graph paper,
with the beam tracing out any desired sequence of (x,y) coordinates.
The standard configuration
(graphing signals as functions of time): The most common
oscilloscope setup has the horizontal deflection managed by an internal circuit
which moves the beam at constant speed across the screen, so its horizontal
coordinate is proportional to the time elapsed since the trace began.
Meanwhile, the vertical deflection of the beam is managed by an external,
time-varying signal, so the vertical coordinate at each point in the trace
gives the value of the external signal at that moment.
In this way, the
oscilloscope trace draws the graph of the external signal as a function of
time.
What kind of signals? Oscilloscopes
respond to voltage. The electron beam is deflected toward
whichever deflection plate in each pair has the higher voltage. Today we will
work with some simple sources of voltage to get familiar with the kind of
graphs the oscilloscope can draw. We will use: ordinary flashlight batteries,
capacitors, and "function generators"
What every oscilloscope has:
1) a power cord.
Plug it in.
2) a power switch.
Find it on the front panel, figure out whether to twist, push or pull it to
turn the device on, and do so.
Wait the few
moments it takes for the scope to warm up. Look on the control panel for the
pilot light (often green or orange and small) and the "intensity"
control. If a spot or line appears on the screen, adjust the intensity so that
it is clearly visible but not blazingly bright. The fluorescent coating on the
screen will burn out if a too-bright spot is left on one place too long, so
acquire the habit now of never leaving the intensity high.
3) a horizontal deflection circuit . What you
find on the front panel of the scope are the key controls for this circuit, the
rate controls (marked something like
"seconds/division" or "sec/div") and the trigger controls.
The trigger
controls govern when the trace starts across the screen. Set them for LINE, not EXT or INT, and twist the "trigger level" knob
until the light beside it comes on.
The rate control
governs the horizontal speed of the trace. Look closely at the markings on the dial; explore the
effect of different settings. Some should give you an isolated spot, slowly
traversing the screen, others a line (actually the blur of a spot moving so
fast your eyes can't isolate it). If there is no spot, ask for help.
Go to one of the
slow settings, and verify the numerical value (.2 sec/div or .5 sec/div or
whatever) by counting the markings the spot traverses while you measure the
time with a stopwatch.
The markings on
the scope face allow you to read times, as you will see in later. By changing
the sec/div setting, you are changing the scale of the horizontal scale.
Question: At the
slow setting you verified, how fast is the spot moving across the screen (in
centimeters per second)?
4) a vertical deflection circuit . This is
for deflecting the beam vertically, and is designed to give a deflection
proportional to the external signal being studied. Since you haven't connected
to any vertical signal yet, you can't get vertical deflections, but you can
locate the key controls. The vertical
scale control is marked
"volts/div" or the equivalent. The "dual trace" scopes you
will be using can display two signals at once, so there are two identical sets
of vertical controls, usually marked Channel 1 and Channel 2 or the equivalent,
but sometimes just placed side-by-side. There is also a position control for each channel and one or more buttons or
switches for selecting whether 1, 2, or both are displayed. Test out the
effects of these controls.
The probe: At this point, you have a scope with full internal functioning,
but it is deaf -- there is no way for an external signal to get in. Any two
wires might serve, but specially designed probes
are usually more convenient.
The probes we
provide have a feature to be aware of: they "attenuate" (i.e. reduce)
the voltage they transmit by 10 times, and you need to take this into account
in reading signal voltages on the screen.
Working with a battery
Now it is time to
use the scope to measure a voltage. Position the trace halfway up the screen,
and set the vertical input to DC. With the scope on one of the slow settings,
connect the two probe wires to the two ends of your flashlight battery. Note
what happens to the moving spot. Connect and disconnect the probe several times
to verify that the same thing always happens. If the spot disappears, try a
less sensitive vertical setting (i.e. one with more volt/div), and see what
happens. Now change the time scale to several of the faster sweeps (fewer
seconds per division) and see if the same thing happens.
Reverse the way
the probe connections to the battery. Now what happens? Verify as before. Look
at combinations of batteries -- series, parallel, etc, to get more confidence
in reading voltages off the screen, and also to look at some non-trivial
questions, e.g. is the voltage of batteries in series actually the sum of the
individual voltages? what about parallel combinations?
You can interpret
an upward deflection of the oscilloscope beam to mean that electrons in the
main probe contact (the center one, often with a hooked end) are at a lower
energy than the ones in the secondary contact. A downward deflection means they
are at a higher energy. (It's a historical accident that the upward direction,
which you would think would mean more of whatever it measures, got associated
with positive charge, while electrons, the usual carriers of charge, have
negative charge, and so have higher energy when they are at the negative end of
a battery or other voltage source -- and negative,
on an oscilloscope, means downward. The
amount higher or lower can be read off the screen, using the vertical
markings and remembering that the control panel setting tells you the scale,
the number of volts per vertical division. For example, a downward deflection
of 1.5 divisions at a setting of 0.2 volts/div means an energy 0.3 volts higher
on the central electrode (people usually say, "A voltage of -0.3,"
for short).
Measure the
voltage of your battery (i.e. how much more negative the - end is than the + end). Reverse the connection and see if
you can interpret the deflection to tell you the same voltage.
Working with a power supply
Turn on the DC
power supply and connect the probe to its output terminals.
"Ground": The oscilloscope needs to be properly
connected to the black terminal of the power supply. This terminal carries the
so-called "ground" voltage, which is basically just that -- the
voltage of the planet Earth's surface here, which is commonly used as a
reference level for comparing voltages. Using
ground is an important safety matter.
It is not a major consideration in this Exploration, but it is generally
quite important to have good ground connections between different items of
electrical equipment, because it helps to prevent large unintended voltage
differences from building up between them, and so it greatly reduces the danger
of electric shock and burnout.
Some probes make
the ground connection with a small black alligator clip on the probe itself.
Others need a separate ground connection from the vertical input panel (look
for a small screw-top terminal and make the connection with hookup wire.)
As you connect the
probe, you should see the trace deflect and then hold steady. (As before, if it
disappears, try a less sensitive setting). If the supply has an adjustable VOLTAGE knob, turning it should move the trace up and
down. Disconnecting the probe should bring the trace back to its original
level.
IV. Working with Capacitors
Set up the circuit
shown
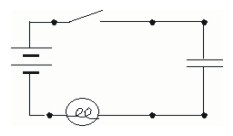
Observe what
happens when you close the switch to complete the circuit, and again when you
open the switch to break the circuit. Using the idea that a capacitor can
absorb charge up to a maximum which depends on the voltage of the charging
source, develop a consistent explanation of this circuit’s behavior.
Now connect the
oscilloscope to graph the voltage across the capacitor during charging and
discharging.
The process of
voltage coming asymptotically to equilibrium, which you have been seeing on the
oscilloscope screen, is called relaxation. Since it is asymptotic, there
is no one time at which it is over. Nevertheless, it is important to have some
way of telling whether the process happens fast or slow, and people are in the
custom of defining a relaxation time as the time it take for voltage to
move a certain fraction closer to its final limiting value. There are two
common times, the half-life (time to move half-way toward limiting
value) and the base-e relaxation time (time to move to 1/e of the
starting value; confusingly enough, this is usually called “the relaxation
time”, as if it were the only possibility).
Measure the
relaxation time of your capacitor and bulb circuit.
Working with a function generator
The function
generator can create a variety of simple, repetitive voltage functions (voltage
as a function of time) at a wide variety of different strengths and
frequencies. The plan is to use it to study charging and discharging of capacitors,
with the oscilloscope as the measuring device.
Square Waves
Examine the
function generator’s front panel; find settings for type of wave, and
frequency; fit BNC-to-banana connector to front. Set the function generator for
square waves at around 5000 Hz. Hook the scope probe from Channel 1 to
the function generator output.
To get a
comprehensible signal, you need to make use of trigger feature of scope:
this is a circuit which synchronizes the sweep of the oscilloscope with the
signal under study, and allows you to study very fast repetitive signals by
getting each successive sweep to start at the same place in the cycle of the
signal. Find the trigger controls, set to INT and CH 1. Find the effect of
adjusting the trigger level control.
After getting a
stable signal on the scope, leave scope on one setting, investigate effect of
changing frequency and amplitude settings of function generator. Now, leaving function generator
unchanged, investigate effect of changing scope settings for vertical (voltage)
and horizontal (time) scales
Now get a small
capacitor and resistor from the supply, connect them in series with the
function generator, hook the scope probe across the capacitor. Change time
scale until the full shape of curves can be seen (i.e. curves have settled down
to their asymptotes). Measure relaxation time for this RC combination.
Report: Description of each step you completed, with sketches of the scope face as relevant, and explanations of all observations in terms of charge distributions and flows.