Chapter 1 – Looking Behind the Numbers
Chapter 1 Question… Mean, Median, Mode
Masao has graded the final exams from last term. There were 12 people in the class and their scores were, 100, 96, 98, 67, 100, 100, 88, 82, 94, 87, 92, and 99. Please create a stem and leaf plot to show the data, then calculate the mean, median, mode, and range. Which of these numbers best represents the data? Why?
Answers:
67, 82, 87, 88, 92, 94, 96, 98, 99, 100, 100, 100
Test Scores
6 |
7 |
7 |
|
8 |
2, 7, 8 |
9 |
2, 4, 6, 8, 9 |
10 |
0, 0, 0 |
Mean: 92
Median: 95
Mode: 100
Range: 33
I think the mean does a pretty good job of representing this data. Since a few people got 100, and one person got 67 you might want to include the range too.
The Mysterious Footprint
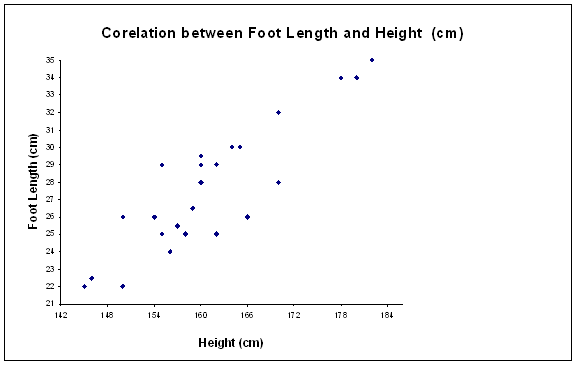
Heather and Seth were excited for the afternoon math class to begin. It was their turn to teach. They had made an especially delicious batch of brownies that morning to be used for one of their assignments. They carefully placed the brownies, along with a bag of flour, down on one of the tables and left the room to fetch paper, markers and other accessories needed for the lesson to run smoothly. Returning with arms loaded with materials, they discovered to their utmost amazement that the brownies had disappeared. The bag of flour had tumbled over spilling all over the floor and interesting enough a footprint, 31 cm long, blatantly starred up at them. Coincidently one of their assignments was to analyze the correlation between foot length and height. So both Seth and Heather quickly got out their graph.

Problem:
Chapter 2 – Mathematics of Motion
SPEED = DISTANCE divided by TIME
DISTANCE = SPEED x TIME
TIME = DISTANCE divided by SPEED
Laura and Nicole drove for 30 minutes at 40 miles per hour, for 1 hour at 60 miles per hour, and for 20 minutes at 54 miles per hour.
Chapter 3 – Shapes in Space
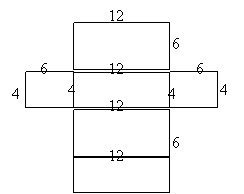
6ft 4ft
4ft
12ft
Note: I recommend that you add the measurements (6ft, 4ft, and 12ft) to your net. It may help you with question number 2.
Don’t forget to include the ft, ft 2, and ft 3 in your answers.
Formulas:
Surface area of a rectangle = Length x Width
![]() w
w
l
Volume of a rectangular prism = Length x Width xHeight
h  w
w
l
ANSWERS TO TEST QUESTIONS
1) There can be various answers to this question.

4
12
2) Surface Area = 24ft 2 + 24ft 2 + 72ft 2 + 72ft 2 + 48ft 2 +48ft 2
Surface Area = 288ft 2
3) Volume = 12ft x 4ft x 6ft
Volume = 288ft 3
Chapter 4: What Comes Next?
Jana and Kari
1. Create an addition growth sequence using 1.6 as the starting number and the growth number. Complete 5 steps.
*Answer: 1.6 3.2 4.8 6.4 8
2. Solve for the growth number and fill in the missing numbers on this addition growth sequence:
2 __ __ 11
*Answer: 2 5 8 11
g = (B-A)/N = (11-2)/3 = 9/3 = 3
g = 3
3. Find the growth number and the 100 th term for the sequence:
6 13 20 27 34
*Answer: Starting number + growth number(n – 1)
Remember that n = the term you are looking for
6 + 7 (n – 1) = 6 + 7 (99) = 6 + 693 = 699
100 th term = 699
3. Describe a way to find the missing numbers in this sequence
5, ___, ____, 17
4.
Fill in the missing numbers:
2, ___, ___, 31.25
What growth number did you use? Was it addition or multiplication sequence?
Seth Vanzant
Chapter 5 - Exploring the Unknown
Test Questions (Evaluating Expressions)
Evaluate each expression for the given values of the variables
1. Evaluate 7x + 2 for:
a) x = 2 b) x = 5 c) x = 3
2.Evaluate x 2 + 4x for:
a) x = 1 b) x = 2 c) x = 6
3.Evaluate 4y – 6 for
a) y = 0 b) y = 4 c) y= ½
4.Write an expression for the collection of Lab Gear blocks below. Then evaluate the expression for the given values of the variables.

a) x = 3 b) x = 5 c) x = 4
Heather Schuiling
MET
Test Questions for Final Exam
Chapter 6 - Roads and Ramps: Slopes, Angles, and Ratios
Slope angle 30°, length 14m
Chapter 7 – Family Portrats
If a rock is thrown straight up (say we have a faulty catapult. Whoops!) at a speed of 114 feet per second, its height (in feet) after t seconds will be h = 114t – 19t².
Find the height of the rock after 0, 1, 2, 3, 4, 5, and 6 seconds. Show results in a table.
Use table to plot points and make a graph. Show time on the x axis and height on the y axis.
According to your graph, when does the rock reach maximum height?
When the rock is about 100 feet away from you, you probably ought to step out of the way. How many seconds will it take for the rock to be that close to you?
Which direction does your parabola open? Why?
ANSWERS
Chapter 7 – Family Portraits
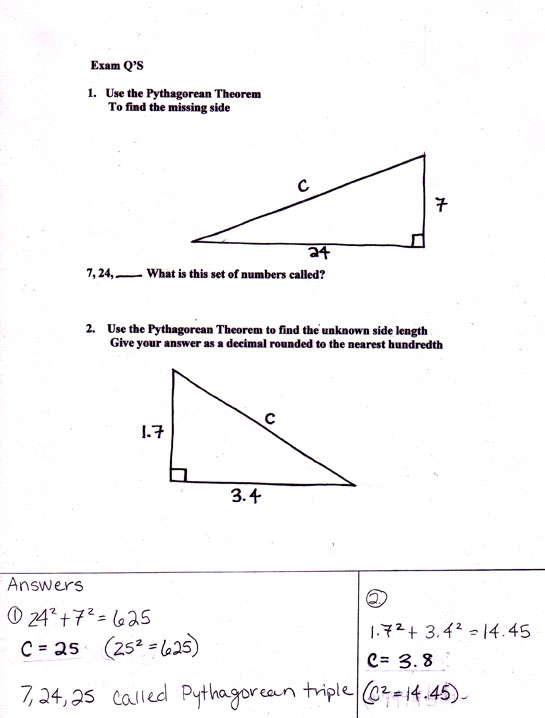
1. Graph this chart:
x |
y |
0 |
0 |
1 |
10 |
2 |
16 |
3 |
18 |
4 |
16 |
5 |
10 |
6 |
0 |
What is the line of symmetry for this parabola? Show it on your graph.
What is the highest value for x?
Answer to problem #1: (Highest value of x=3.)
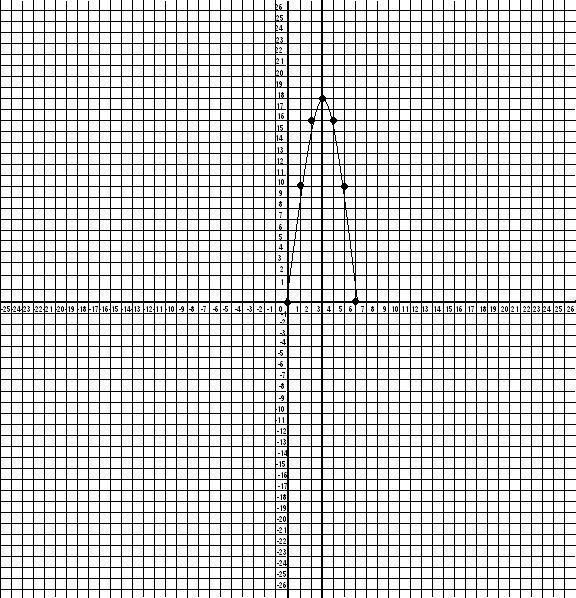
2. Graph this chart:
x |
y |
0 |
0 |
1 |
12 |
2 |
20 |
3 |
24 |
4 |
24 |
5 |
20 |
6 |
12 |
7 |
0 |
What is the line of symmetry for this parabola? Show it on your graph.
What is the highest value for x?
Answer to problem #2: (Highest value of x=3.5)
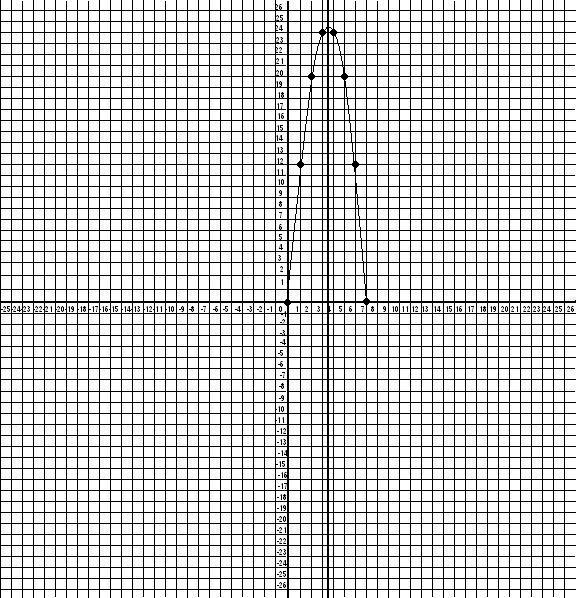
3. Make a t-chart and graph of each of the following equations:
a. b.
ANSWER:
a1 |
b1 |
||||||||||||||||||||||||||||||||||||||||||||||||
|
|
||||||||||||||||||||||||||||||||||||||||||||||||
a2 |
b2 |
||||||||||||||||||||||||||||||||||||||||||||||||
a3
|
b3
|
ANSWER to #3, continued. 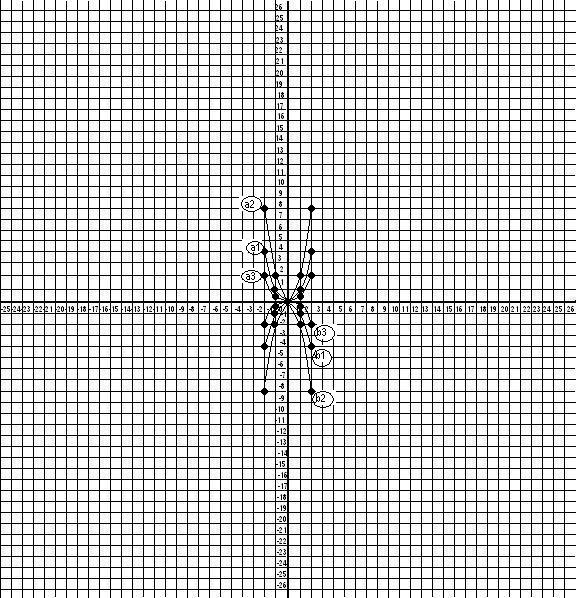
4.
If a rock is thrown straight up (say we have a faulty catapult. Whoops!) at a speed of 114 feet per second, its height (in feet) after t seconds will be h = 114t – 19t².
Find the height of the rock after 0, 1, 2, 3, 4, 5, and 6 seconds. Show results in a table.
ANSWER:
t (x) |
h (y) |
0 |
0 |
1 |
95 |
2 |
152 |
3 |
171 |
4 |
152 |
5 |
95 |
6 |
0 |
Use table to plot points and make a graph. Show time on the x axis and height on the y axis. (SEE GRAPH BELOW)
According to your graph, when does the rock reach maximum height?
ANSWER: the rock reaches maximum height at 3 seconds.
When the rock is about 100 feet away from you, you probably ought to step out of the way. How many seconds will it take for the rock to be that close to you?
ANSWER: I’ve got 5 seconds to get out of the way!
Which direction does your parabola open? Why?
ANSWER: This is a downward-facing parabola. It is shaped that way because it shows the relationship of gravity upon propulsion and time. You would be able to tell this by looking at the problem, as the coefficient (that’s the second number on the right hand side of the problem,) is negative.
ANSWER to problem #4 continued. 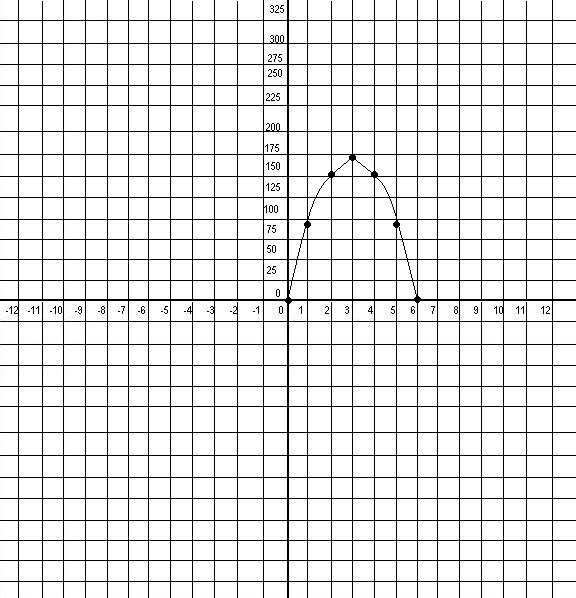
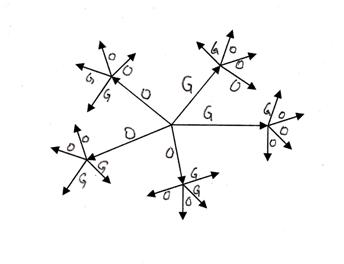
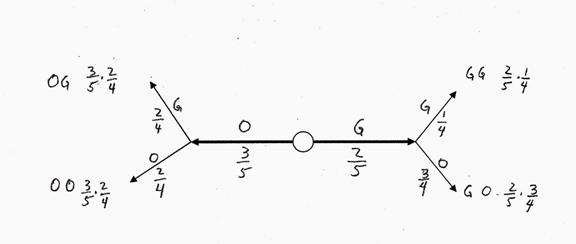
Chapter 8 – Probability
Answers:
2,1; 2,2; 2,3; 2,4; 2,5
3,1; 3,2; ;3,3;3,4; 3,5
4,1; 4,2; 4,3; 4,4; 4,5
1.b 2/20
1.c 4/20
1.d 3/20
\2. 