3D Visualization
3D Visualization
Three-dimensional visualizations can show an extrodinary amount of detail and context, and interactive 3D visualization applications provide an immersive environment which allows users to better understand data and view it in a three-dimensional context such as a digital elevation map.
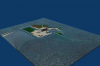
![]() CanopyView is an interactive canopy visualization system built at The Evergreen State College in Olympia Washington and funded by the National Science Foundation.
CanopyView is an interactive canopy visualization system built at The Evergreen State College in Olympia Washington and funded by the National Science Foundation.
CanopyView is used to visualize a variety of data in different ways.
Terrain Modeling
- Sea Level Rise
 We created animations representing sea level rise for the regions of the Turkey Point and St. Lucie nuclear reactors using the open source 3D modeling program, "Blender" based on height maps for these regions. The sea level rise scenarios were determined based on recommendations outlined in the International Atomic Energy Agency’s report, Flood Hazard for Nuclear Power Plants on Coastal and River Sites.
 - 3D Water Visualization
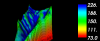 The 3D Water Visualization application is designed to visualize modeled soil data on a 3D topography, as well as a graph of measured rainfall and measured and modeled stream discharge data. The application also allows users to view data through time to see how the data changes.