Representations of Atomic, Hybrid & Molecular Orbitals
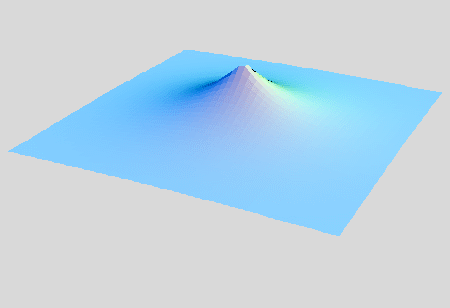
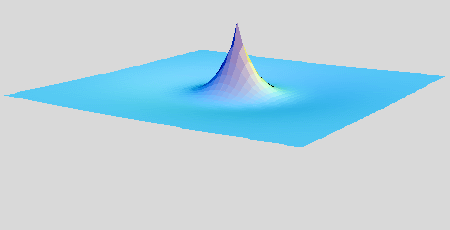
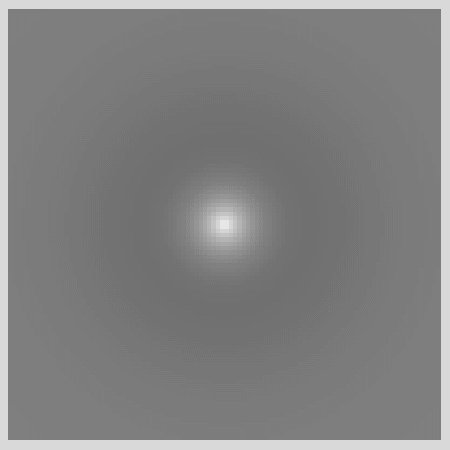
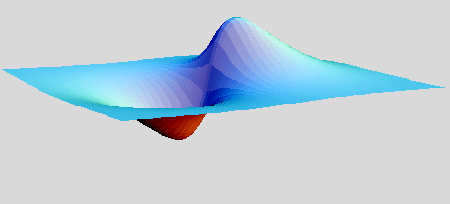
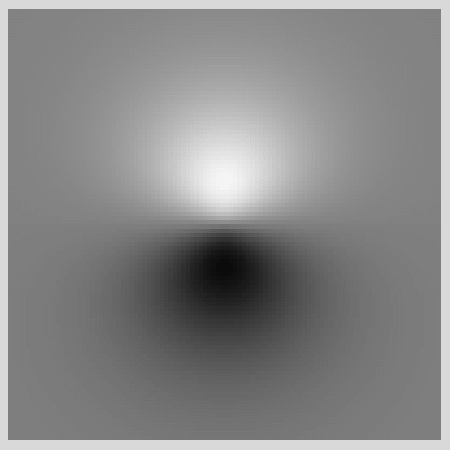
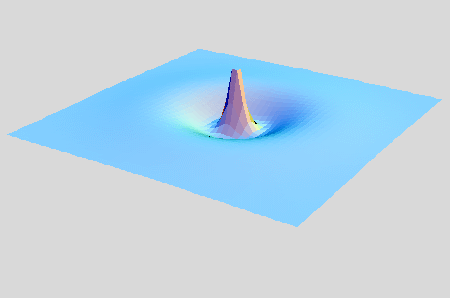
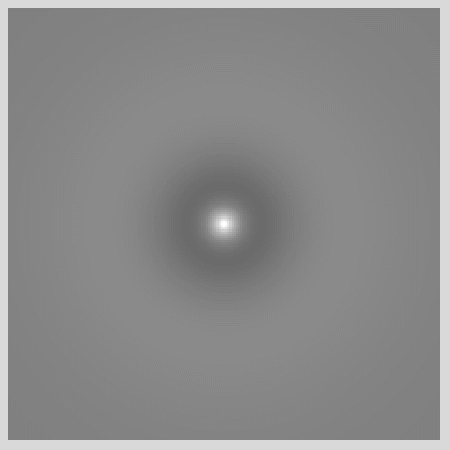
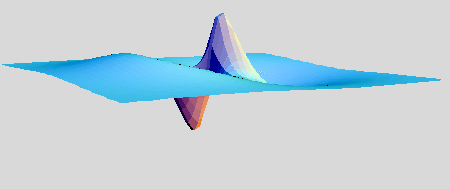
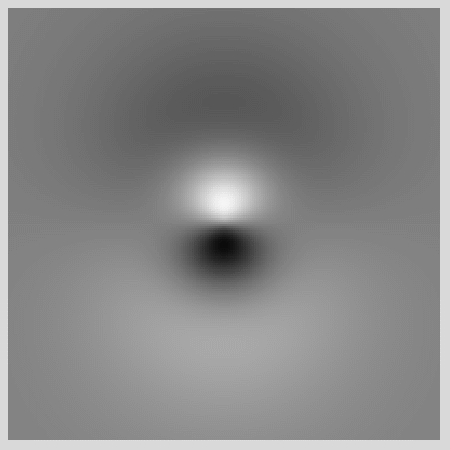
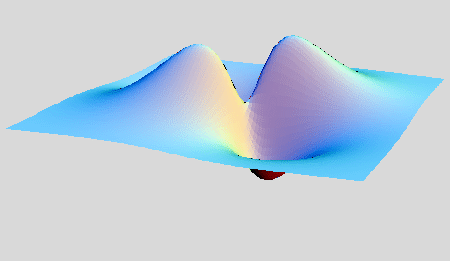
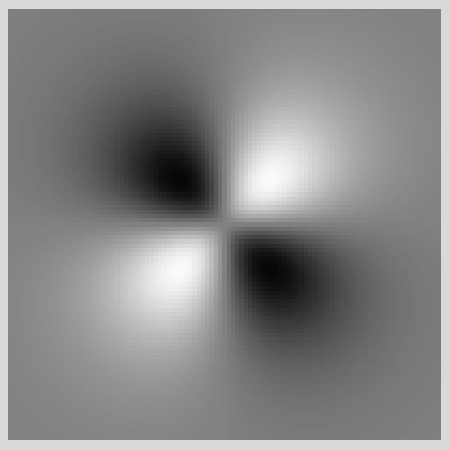
The images and animations listed below were generated using Mathematica and are intended to help in the visualization of the wave properties of atomic orbitals. Click on the type of animation, either 2-Dimensional or Contour, you want to see. The 2-Dimensional Images present the wavefunctions in an xy-plane, reserving the z-axis for wave amplitude. The contour plots use a gray-scale to indicate wave amplitudes (white is maximum, black is minimum).
Please feel free to communicate questions or comments
to John Bullock at bullockj@evergreen.edu.
|
|
|
|
|
|
 |
|
|
|
 |
 |
|
|
 |
 |
|
|
 |
 |
|
|
 |
 |
|
|
 |
 |
Created by: John Bullock
Last Updated: 1/26/2000
Return to Chemistry
Program homepage
Return to Matter
& Motion homepage
Return to Evergreen homepage