NSF Workshop on Canopy Structure Data - Dr. Akihiro Sumida
Dr. Akihiro Sumida
Explanation of the data sets of skeleton trees
The objective of the study is to investigate the effects
of spatial structure (skeleton structure of trunks and branches) on neighborhood
competition patterns among hardwood trees. Results will soon be published
from Annals of Botany. In the following the method of measurements is
mainly summarized for my data sets to be understood.
Study plot and equipments
In a hardwood forest, three-dimensional coordinates (x, y, z) were settled
in the study plot with an area of about 20 m x 25 m, with positive direction
of y being north and z vertical. The plot included 10 canopy trees of
Japanese chestnut Castanea crenata. Crowns of 16 other canopy trees (7
species) neighbored those of C. crenata.
To survey tree structure, we used a theodolite equipped with a visible
(red) laser range finder. With the range finder, measurement for distances
up to 60 m is possible without a reflector. With the visible laser we
can confirm where we are aiming (or to which distance we are measuring)
even in a dense forest. Three-dimensional coordinates of the target where
red laser is spotted is automatically calculated, displayed on the monitor
of the theodolite, and stored in a pocket computer.
Surveying a tree
For most of the primary branches (= stems branching off the main trunk)
of the chestnut trees, three-dimensional positions of their base, tip,
and several turning points of branch direction were measured using the
theodolite. Primary branches around the top of a trunk (about 2 m from
treetop) were not always measured because they were relatively short and
so often invisible. For species other than C. crenata, only the primary
branches extending towards neighboring C. crenata trees were surveyed.
Position measurement for the trunk was made for trunk base, 1.3-m height
point, and the treetop other than the junctions of the primary branches.
Since the laser was aimed on the surface of branches and trunks, measured
positional data do not represent internal positions of tree body. Hence
we rounded the position data to nearest 10 cm. However, because of the
large size of trees, this procedure does not affect essential results.
The theodolite was set at multiple points (“survey points”)
on the forest floor to survey from different sides of a single tree.
Unification of 3-D coordinates
Since the built-in frame of reference of the theodolite changes every
time it is moved to a different “survey point”, the coordinates
of all these survey points needed to be linked with one another. Therefore,
arbitrarily chosen fifteen points (“reference points”) were
further set on the forest floor, and the three-dimensional coordinates
of these reference points were determined by ordinary closed traverse
survey. Then the positions of the survey points were surveyed from some
of the reference points to link them together. In this way, all the three-dimensional
data were finally converted into the unified coordinates of the study
area. It took us a total of 20 days (between July and early December)
to carry out all the field measurements.
Visualization
With the three-dimensional data obtained, the skeleton structure of the
tree was visualized on a personal computer using a three-dimensional line-graphics
facility of graphics package (DeltaGraph, Japan Poladigital). 3-D coordinates
of the measured points were input and arranged on a Excel spreadsheet
before they were copy-and-pasted onto a DeltaGraph spreadsheet. On a 3-D
graphics plane of DeltaGraph, two data points were linked by a line in
order of data row; For example, imagine point 1 (x1, y1, z1) shows branch
base, point 2 (x2, y2, z2) a turning point of branch direction and point
3 (x3, y3, z3) the branch tip. Then we input (x1, y1, z1) in the first
row, (x2, y2, z2) in the second row and (x3, y3, z3) the third row. DeltaGraph
automatically connects these three points in this order with two line
segments. Therefore, the data sets for visualization are simply made of
a sequence of rows of 3-D data points of trunks and branches. An example
of the visualization is available at the homepage of my lab ( http://www.lowtem.hokudai.ac.jp/plantecol/home-e.html
; note, the picture is not of the chestnut forest but that of an oak forest).
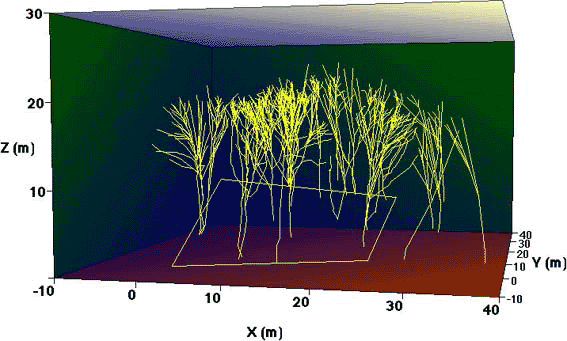
Three-dimensional spatial structure of the trunk and branches of a broad-leaved forest reconstructed from data measured using the Theodorite laser surveyor. The yellow rectangle outlines the survey area (25mX20m)
Analyses
Several analyses were made to evaluate effects of the presence of nearby
branches on chestnut crown expansion. One of them includes an analysis
for extending direction (branch vector) of each branch. I think data sets
that can represent “vector” (connection between 3-D points)
are important for explaining present structure and predicting future structure.