Simple Root Visualization
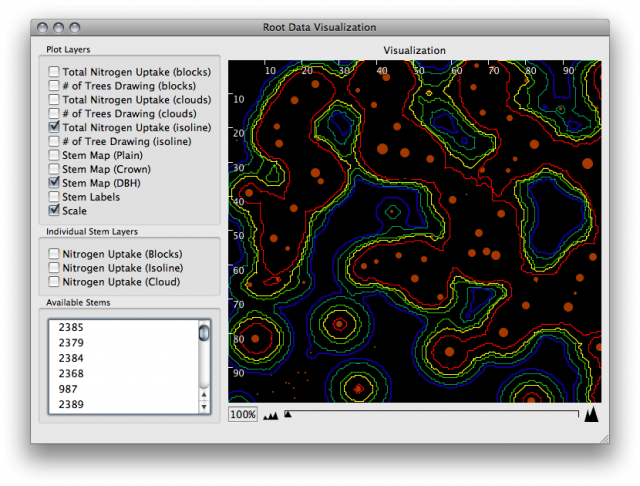
The Simple Root Visualization application visualizes real and modeled nitrogen uptake data. The data represents a plot on a grid. For each tree and each grid cell, a value represents how much nitrogen is being consumed from the cell by that tree. The application uses this data to produce a variety of visualizations, including color-coded grid cells (shown) and isolines representing total nitrogen uptake, as well as color-coded grid cells and isolines for the number of different trees drawing nitrogen from an area.
Downloads
- v0.27 for Windows (3.9MB)
- v0.27 for Mac (Universal) (1.8MB)
- Large Dataset (Compressed/Zipped) (2.4MB)
Version History
- 0.22
- Made threading more robust. Should have less thread-related crashes now.
- 0.24
- Switched to using a database, instead of CSV files.
- Major speed improvements.
- Reliability improvements (less crashes).
- Can now handle some larger data sets somewhat gracefully.
- 0.25
- Fixed isoline-related crash.
- Added a progress window for the (sometimes lengthly) data-loading and indexing process.
- Minor changes.
- 0.26
- Selected stems are now highlighted in the visualizaiton.
- Progress window looks better in Windows.
- 0.27
- Improved stability
- User-defined color gradients.
- Now prompts for a dataset at startup instead of requiring the dataset be packaged.
Known Issues