Terrain Modeling
Terrain Modeling
- Sea Level Rise
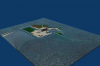 We created animations representing sea level rise for the regions of the Turkey Point and St. Lucie nuclear reactors using the open source 3D modeling program, "Blender" based on height maps for these regions. The sea level rise scenarios were determined based on recommendations outlined in the International Atomic Energy Agency’s report, Flood Hazard for Nuclear Power Plants on Coastal and River Sites.
 - 3D Water Visualization
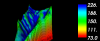 The 3D Water Visualization application is designed to visualize modeled soil data on a 3D topography, as well as a graph of measured rainfall and measured and modeled stream discharge data. The application also allows users to view data through time to see how the data changes.
 - Yosemite Visualization
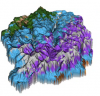 This animation shows the vegetation type each year at Yosemite for
projected climate using the MIROC climate change model from 2006 to
2099. Vegetation type is modeled in grid squares 800 meters on a side,
with colors keyed in the legend on the left of the animation.
This animation shows the vegetation type each year at Yosemite for
projected climate using the MIROC climate change model from 2006 to
2099. Vegetation type is modeled in grid squares 800 meters on a side,
with colors keyed in the legend on the left of the animation.