Sea Level Rise
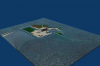 We created animations representing sea level rise for the regions of
the Turkey Point and St. Lucie nuclear reactors using the open source
3D modeling program, "Blender" based on height maps for these regions.
The sea level rise scenarios were determined based on recommendations
outlined in the International Atomic Energy Agency’s report, Flood Hazard for Nuclear Power Plants on Coastal and River Sites.
We created animations representing sea level rise for the regions of
the Turkey Point and St. Lucie nuclear reactors using the open source
3D modeling program, "Blender" based on height maps for these regions.
The sea level rise scenarios were determined based on recommendations
outlined in the International Atomic Energy Agency’s report, Flood Hazard for Nuclear Power Plants on Coastal and River Sites.
| Attachment | Size |
|---|---|
| Sealevel Rise Visualization 1 (AVI) | 3.18 MB |
| Sealevel Rise Visualization 1 (H.264) | 934.08 KB |
| Sealevel Rise Visualization 1 (MP4) | 4.34 MB |
| Sealevel Rise Visualization 2 (AVI) | 4.49 MB |
| Sealevel Rise Visualization 2 (H.264) | 492.86 KB |
| Sealevel Rise Visualization 2 (MP4) | 949.6 KB |