Yosemite Visualizations
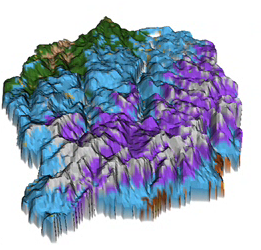 This animation shows the vegetation type each year at Yosemite for projected climate using the MIROC climate change model from 2006 to 2099. Vegetation type is modeled in grid squares 800 meters on a side, with colors keyed in the legend on the left of the animation.
| Attachment | Size |
|---|---|
| Yosemite Visualization (WMV) | 1.11 MB |